Cities with the Highest Percentage of Population Driving Alone to Work in Kentucky
RELATED REPORTS & OPTIONS
Drive | Alone
Kentucky
Compare Cities
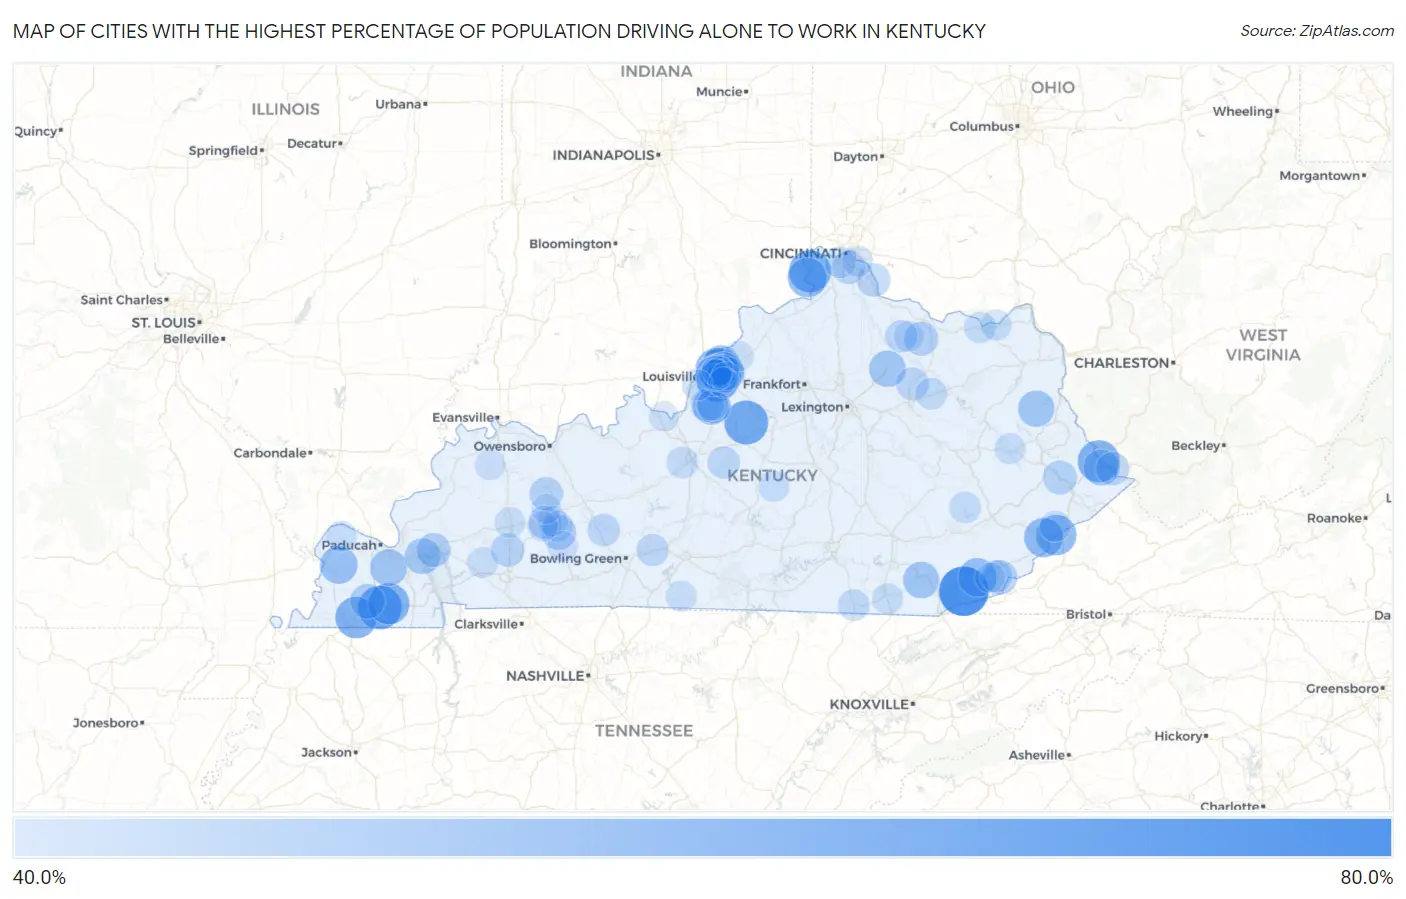
Map of Cities with the Highest Percentage of Population Driving Alone to Work in Kentucky
0.0%
80.0%
Cities with the Highest Percentage of Population Driving Alone to Work in Kentucky
| City | % Drive Alone | vs State | vs National | |
| 1. | Pathfork | 70.3% | 41.8%(+28.5)#1 | 42.1%(+28.2)#33 |
| 2. | Fairfield | 63.4% | 41.8%(+21.6)#2 | 42.1%(+21.3)#250 |
| 3. | Sedalia | 63.1% | 41.8%(+21.3)#3 | 42.1%(+21.0)#276 |
| 4. | Belleview | 61.5% | 41.8%(+19.7)#4 | 42.1%(+19.4)#409 |
| 5. | South Williamson | 61.3% | 41.8%(+19.5)#5 | 42.1%(+19.2)#436 |
| 6. | Water Valley | 60.8% | 41.8%(+19.0)#6 | 42.1%(+18.7)#510 |
| 7. | Farmington | 60.4% | 41.8%(+18.6)#7 | 42.1%(+18.3)#570 |
| 8. | Meadowview Estates | 60.2% | 41.8%(+18.4)#8 | 42.1%(+18.1)#611 |
| 9. | Glenview | 60.1% | 41.8%(+18.3)#9 | 42.1%(+18.0)#619 |
| 10. | Payne Gap | 59.3% | 41.8%(+17.5)#10 | 42.1%(+17.2)#752 |
| 11. | Hills And Dales | 58.5% | 41.8%(+16.7)#11 | 42.1%(+16.4)#911 |
| 12. | Rabbit Hash | 58.1% | 41.8%(+16.3)#12 | 42.1%(+16.0)#1,026 |
| 13. | Mayking | 57.9% | 41.8%(+16.1)#13 | 42.1%(+15.8)#1,055 |
| 14. | Green Spring | 57.5% | 41.8%(+15.7)#14 | 42.1%(+15.4)#1,140 |
| 15. | Loyall | 57.1% | 41.8%(+15.3)#15 | 42.1%(+15.0)#1,266 |
| 16. | Hickory Hill | 56.2% | 41.8%(+14.4)#16 | 42.1%(+14.1)#1,557 |
| 17. | Moseleyville | 56.0% | 41.8%(+14.2)#17 | 42.1%(+13.9)#1,612 |
| 18. | Blandville | 56.0% | 41.8%(+14.2)#18 | 42.1%(+13.9)#1,616 |
| 19. | Creekside | 55.4% | 41.8%(+13.6)#19 | 42.1%(+13.3)#1,779 |
| 20. | Fox Chase | 55.2% | 41.8%(+13.4)#20 | 42.1%(+13.1)#1,847 |
| 21. | Symsonia | 55.2% | 41.8%(+13.4)#21 | 42.1%(+13.1)#1,852 |
| 22. | Prospect | 55.1% | 41.8%(+13.3)#22 | 42.1%(+13.0)#1,869 |
| 23. | Millersburg | 54.7% | 41.8%(+12.9)#23 | 42.1%(+12.6)#2,017 |
| 24. | Blaine | 54.6% | 41.8%(+12.8)#24 | 42.1%(+12.5)#2,066 |
| 25. | Artemus | 54.5% | 41.8%(+12.7)#25 | 42.1%(+12.4)#2,092 |
| 26. | Indian Hills | 54.4% | 41.8%(+12.6)#26 | 42.1%(+12.3)#2,137 |
| 27. | Rolling Fields | 54.2% | 41.8%(+12.4)#27 | 42.1%(+12.1)#2,246 |
| 28. | Belfry | 54.2% | 41.8%(+12.4)#28 | 42.1%(+12.1)#2,256 |
| 29. | Grand Rivers | 53.9% | 41.8%(+12.1)#29 | 42.1%(+11.8)#2,360 |
| 30. | Ten Broeck | 53.5% | 41.8%(+11.7)#30 | 42.1%(+11.4)#2,567 |
| 31. | Old Brownsboro Place | 53.2% | 41.8%(+11.4)#31 | 42.1%(+11.1)#2,726 |
| 32. | Pryorsburg | 52.8% | 41.8%(+11.0)#32 | 42.1%(+10.7)#2,919 |
| 33. | Beechmont | 52.7% | 41.8%(+10.9)#33 | 42.1%(+10.6)#2,948 |
| 34. | Kenvir | 52.5% | 41.8%(+10.7)#34 | 42.1%(+10.4)#3,046 |
| 35. | Hebron Estates | 52.0% | 41.8%(+10.2)#35 | 42.1%(+9.90)#3,375 |
| 36. | Kuttawa | 51.8% | 41.8%(+10.0)#36 | 42.1%(+9.70)#3,480 |
| 37. | Mays Lick | 51.8% | 41.8%(+10.0)#37 | 42.1%(+9.70)#3,507 |
| 38. | Meadowbrook Farm | 51.7% | 41.8%(+9.90)#38 | 42.1%(+9.60)#3,564 |
| 39. | Betsy Layne | 51.6% | 41.8%(+9.80)#39 | 42.1%(+9.50)#3,606 |
| 40. | Windy Hills | 51.3% | 41.8%(+9.50)#40 | 42.1%(+9.20)#3,799 |
| 41. | Philpot | 51.3% | 41.8%(+9.50)#41 | 42.1%(+9.20)#3,809 |
| 42. | Island | 51.3% | 41.8%(+9.50)#42 | 42.1%(+9.20)#3,820 |
| 43. | Murray Hill | 51.3% | 41.8%(+9.50)#43 | 42.1%(+9.20)#3,823 |
| 44. | Brownsboro Farm | 51.3% | 41.8%(+9.50)#44 | 42.1%(+9.20)#3,825 |
| 45. | Crofton | 51.3% | 41.8%(+9.50)#45 | 42.1%(+9.20)#3,827 |
| 46. | Brooks | 51.0% | 41.8%(+9.20)#46 | 42.1%(+8.90)#4,035 |
| 47. | Powderly | 51.0% | 41.8%(+9.20)#47 | 42.1%(+8.90)#4,051 |
| 48. | Mockingbird Valley | 51.0% | 41.8%(+9.20)#48 | 42.1%(+8.90)#4,085 |
| 49. | California | 51.0% | 41.8%(+9.20)#49 | 42.1%(+8.90)#4,091 |
| 50. | Mccarr | 50.9% | 41.8%(+9.10)#50 | 42.1%(+8.80)#4,134 |
| 51. | Riverwood | 50.8% | 41.8%(+9.00)#51 | 42.1%(+8.70)#4,188 |
| 52. | Fairview | 50.8% | 41.8%(+9.00)#52 | 42.1%(+8.70)#4,216 |
| 53. | Goose Creek | 50.5% | 41.8%(+8.70)#53 | 42.1%(+8.40)#4,412 |
| 54. | Sharpsburg | 50.4% | 41.8%(+8.60)#54 | 42.1%(+8.30)#4,509 |
| 55. | Brownsboro Village | 50.3% | 41.8%(+8.50)#55 | 42.1%(+8.20)#4,600 |
| 56. | Woodbury | 50.2% | 41.8%(+8.40)#56 | 42.1%(+8.10)#4,721 |
| 57. | Seneca Gardens | 50.1% | 41.8%(+8.30)#57 | 42.1%(+8.00)#4,774 |
| 58. | Mount Olivet | 50.1% | 41.8%(+8.30)#58 | 42.1%(+8.00)#4,807 |
| 59. | New Haven | 50.0% | 41.8%(+8.20)#59 | 42.1%(+7.90)#4,863 |
| 60. | Anchorage | 49.9% | 41.8%(+8.10)#60 | 42.1%(+7.80)#4,927 |
| 61. | Bellemeade | 49.8% | 41.8%(+8.00)#61 | 42.1%(+7.70)#5,040 |
| 62. | Evarts | 49.7% | 41.8%(+7.90)#62 | 42.1%(+7.60)#5,124 |
| 63. | Smiths Grove | 49.7% | 41.8%(+7.90)#63 | 42.1%(+7.60)#5,129 |
| 64. | Druid Hills | 49.4% | 41.8%(+7.60)#64 | 42.1%(+7.30)#5,479 |
| 65. | Knottsville | 49.4% | 41.8%(+7.60)#65 | 42.1%(+7.30)#5,494 |
| 66. | Owingsville | 49.2% | 41.8%(+7.40)#66 | 42.1%(+7.10)#5,625 |
| 67. | Pine Knot | 49.2% | 41.8%(+7.40)#67 | 42.1%(+7.10)#5,630 |
| 68. | St Regis Park | 49.1% | 41.8%(+7.30)#68 | 42.1%(+7.00)#5,717 |
| 69. | Cecilia | 49.1% | 41.8%(+7.30)#69 | 42.1%(+7.00)#5,757 |
| 70. | Buckhorn | 49.1% | 41.8%(+7.30)#70 | 42.1%(+7.00)#5,786 |
| 71. | Vanceburg | 49.0% | 41.8%(+7.20)#71 | 42.1%(+6.90)#5,825 |
| 72. | Lakeside Park | 48.9% | 41.8%(+7.10)#72 | 42.1%(+6.80)#5,909 |
| 73. | Emlyn | 48.6% | 41.8%(+6.80)#73 | 42.1%(+6.50)#6,247 |
| 74. | Bradfordsville | 48.6% | 41.8%(+6.80)#74 | 42.1%(+6.50)#6,254 |
| 75. | Glenview Hills | 48.6% | 41.8%(+6.80)#75 | 42.1%(+6.50)#6,257 |
| 76. | Salyersville | 48.5% | 41.8%(+6.70)#76 | 42.1%(+6.40)#6,317 |
| 77. | Bancroft | 48.5% | 41.8%(+6.70)#77 | 42.1%(+6.40)#6,355 |
| 78. | Pioneer Village | 48.4% | 41.8%(+6.60)#78 | 42.1%(+6.30)#6,452 |
| 79. | Garrison | 48.4% | 41.8%(+6.60)#79 | 42.1%(+6.30)#6,480 |
| 80. | Mcroberts | 48.4% | 41.8%(+6.60)#80 | 42.1%(+6.30)#6,484 |
| 81. | Glenview Manor | 48.4% | 41.8%(+6.60)#81 | 42.1%(+6.30)#6,514 |
| 82. | Drakesboro | 48.3% | 41.8%(+6.50)#82 | 42.1%(+6.20)#6,616 |
| 83. | Cerulean | 48.3% | 41.8%(+6.50)#83 | 42.1%(+6.20)#6,621 |
| 84. | Fountain Run | 48.3% | 41.8%(+6.50)#84 | 42.1%(+6.20)#6,639 |
| 85. | Maryhill Estates | 48.3% | 41.8%(+6.50)#85 | 42.1%(+6.20)#6,644 |
| 86. | Mortons Gap | 48.2% | 41.8%(+6.40)#86 | 42.1%(+6.10)#6,740 |
| 87. | Bandana | 48.1% | 41.8%(+6.30)#87 | 42.1%(+6.00)#6,910 |
| 88. | Shively | 48.0% | 41.8%(+6.20)#88 | 42.1%(+5.90)#6,927 |
| 89. | Silver Grove | 48.0% | 41.8%(+6.20)#89 | 42.1%(+5.90)#6,972 |
| 90. | Sycamore | 47.9% | 41.8%(+6.10)#90 | 42.1%(+5.80)#7,127 |
| 91. | Poole | 47.9% | 41.8%(+6.10)#91 | 42.1%(+5.80)#7,129 |
| 92. | Forest Hills | 47.8% | 41.8%(+6.00)#92 | 42.1%(+5.70)#7,213 |
| 93. | Dunmor | 47.8% | 41.8%(+6.00)#93 | 42.1%(+5.70)#7,231 |
| 94. | Cleaton | 47.8% | 41.8%(+6.00)#94 | 42.1%(+5.70)#7,248 |
| 95. | Sardis | 47.8% | 41.8%(+6.00)#95 | 42.1%(+5.70)#7,253 |
| 96. | Greenville | 47.7% | 41.8%(+5.90)#96 | 42.1%(+5.60)#7,289 |
| 97. | Buckner | 47.5% | 41.8%(+5.70)#97 | 42.1%(+5.40)#7,505 |
| 98. | Doe Valley | 47.5% | 41.8%(+5.70)#98 | 42.1%(+5.40)#7,528 |
| 99. | Ages | 47.4% | 41.8%(+5.60)#99 | 42.1%(+5.30)#7,743 |
| 100. | South Carrollton | 47.4% | 41.8%(+5.60)#100 | 42.1%(+5.30)#7,762 |
Common Questions
What are the Top 10 Cities with the Highest Percentage of Population Driving Alone to Work in Kentucky?
Top 10 Cities with the Highest Percentage of Population Driving Alone to Work in Kentucky are:
#1
70.3%
#2
63.4%
#3
63.1%
#4
61.5%
#5
61.3%
#6
60.8%
#7
60.4%
#8
60.2%
#9
60.1%
#10
59.3%
What city has the Highest Percentage of Population Driving Alone to Work in Kentucky?
Pathfork has the Highest Percentage of Population Driving Alone to Work in Kentucky with 70.3%.
What is the Percentage of Population Driving Alone to Work in the State of Kentucky?
Percentage of Population Driving Alone to Work in Kentucky is 41.8%.
What is the Percentage of Population Driving Alone to Work in the United States?
Percentage of Population Driving Alone to Work in the United States is 42.1%.