Betsy Layne, KY Map & Demographics
Betsy Layne Map
Betsy Layne Overview
$25,575
PER CAPITA INCOME
$43,493
AVG HOUSEHOLD INCOME
0.40
INEQUALITY / GINI INDEX
662
TOTAL POPULATION
287
MALE POPULATION
375
FEMALE POPULATION
76.53
MALES / 100 FEMALES
130.66
FEMALES / 100 MALES
57.7
MEDIAN AGE
2.5
AVG FAMILY SIZE
2.0
AVG HOUSEHOLD SIZE
225
LABOR FORCE [ PEOPLE ]
38.8%
PERCENT IN LABOR FORCE
9.8%
UNEMPLOYMENT RATE
Betsy Layne Zip Codes
Betsy Layne Area Codes
Income in Betsy Layne
Income Overview in Betsy Layne
| Characteristic | Number | Measure |
| Per Capita Income | 662 | $25,575 |
| Median Family Income | 229 | $0 |
| Mean Family Income | 229 | $57,198 |
| Median Household Income | 325 | $43,493 |
| Mean Household Income | 325 | $52,545 |
| Income Deficit | 229 | $0 |
| Wage / Income Gap (%) | 662 | 0.00% |
| Wage / Income Gap ($) | 662 | 100.00¢ per $1 |
| Gini / Inequality Index | 662 | 0.40 |
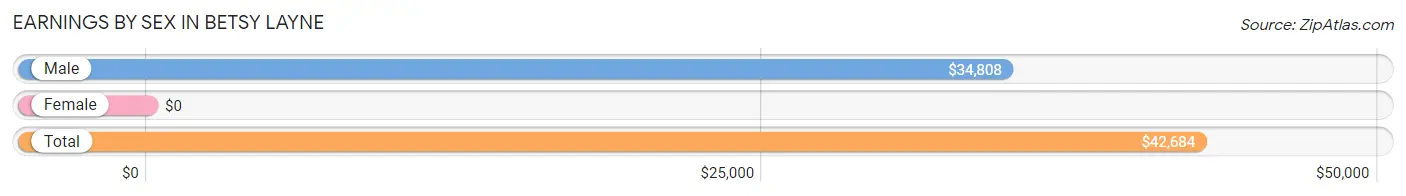
Earnings by Sex in Betsy Layne
| Sex | Number | Average Earnings |
| Male | 100 (49.3%) | $34,808 |
| Female | 103 (50.7%) | $0 |
| Total | 203 (100.0%) | $42,684 |
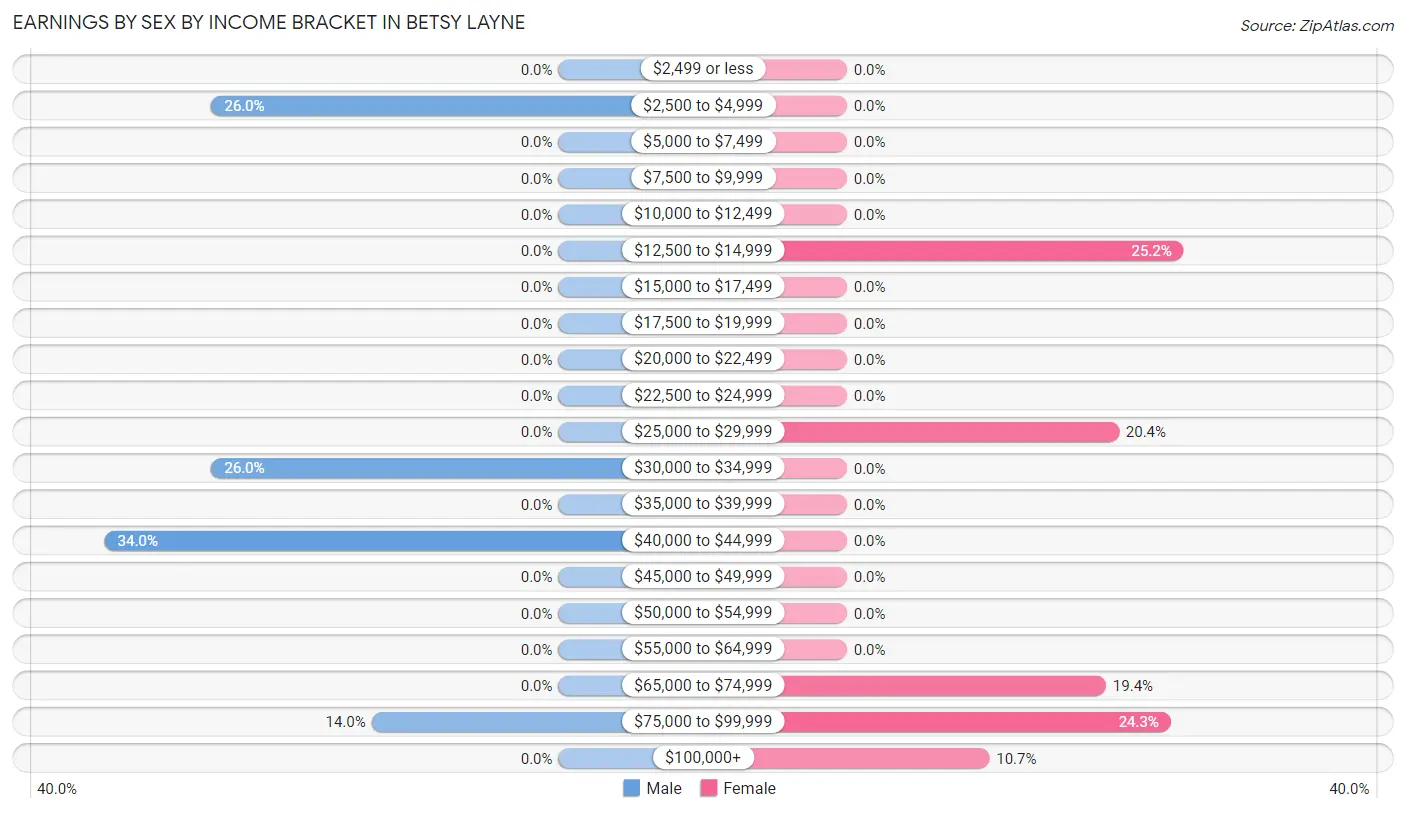
Earnings by Sex by Income Bracket in Betsy Layne
The most common earnings brackets in Betsy Layne are $40,000 to $44,999 for men (34 | 34.0%) and $12,500 to $14,999 for women (26 | 25.2%).
| Income | Male | Female |
| $2,499 or less | 0 (0.0%) | 0 (0.0%) |
| $2,500 to $4,999 | 26 (26.0%) | 0 (0.0%) |
| $5,000 to $7,499 | 0 (0.0%) | 0 (0.0%) |
| $7,500 to $9,999 | 0 (0.0%) | 0 (0.0%) |
| $10,000 to $12,499 | 0 (0.0%) | 0 (0.0%) |
| $12,500 to $14,999 | 0 (0.0%) | 26 (25.2%) |
| $15,000 to $17,499 | 0 (0.0%) | 0 (0.0%) |
| $17,500 to $19,999 | 0 (0.0%) | 0 (0.0%) |
| $20,000 to $22,499 | 0 (0.0%) | 0 (0.0%) |
| $22,500 to $24,999 | 0 (0.0%) | 0 (0.0%) |
| $25,000 to $29,999 | 0 (0.0%) | 21 (20.4%) |
| $30,000 to $34,999 | 26 (26.0%) | 0 (0.0%) |
| $35,000 to $39,999 | 0 (0.0%) | 0 (0.0%) |
| $40,000 to $44,999 | 34 (34.0%) | 0 (0.0%) |
| $45,000 to $49,999 | 0 (0.0%) | 0 (0.0%) |
| $50,000 to $54,999 | 0 (0.0%) | 0 (0.0%) |
| $55,000 to $64,999 | 0 (0.0%) | 0 (0.0%) |
| $65,000 to $74,999 | 0 (0.0%) | 20 (19.4%) |
| $75,000 to $99,999 | 14 (14.0%) | 25 (24.3%) |
| $100,000+ | 0 (0.0%) | 11 (10.7%) |
| Total | 100 (100.0%) | 103 (100.0%) |
Earnings by Sex by Educational Attainment in Betsy Layne
| Educational Attainment | Male Income | Female Income |
| Less than High School | - | - |
| High School Diploma | - | - |
| College or Associate's Degree | - | - |
| Bachelor's Degree | - | - |
| Graduate Degree | - | - |
| Total | $34,808 | $74,688 |
Family Income in Betsy Layne
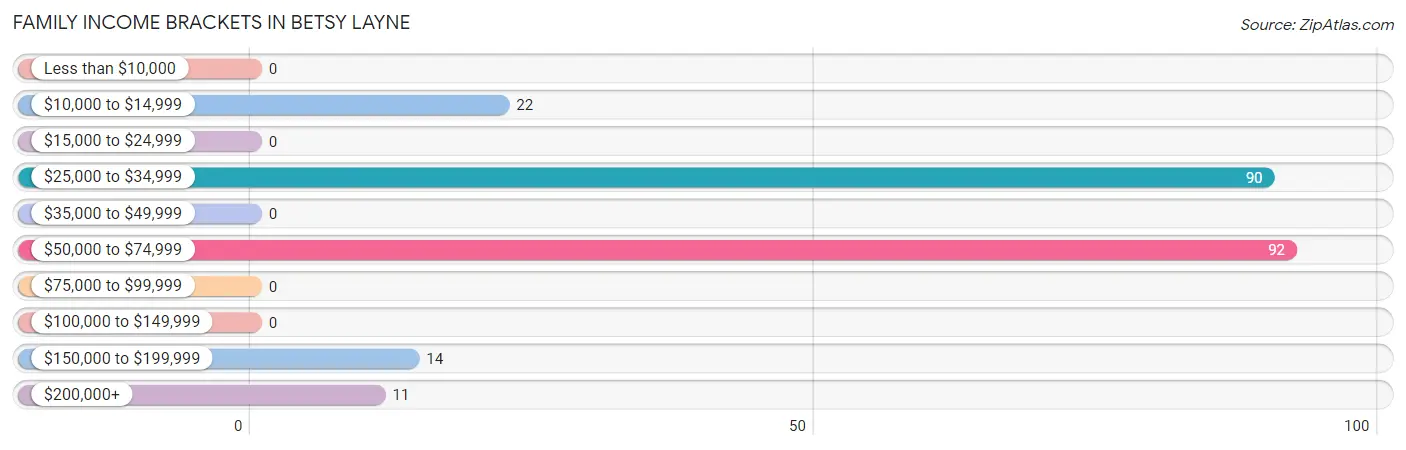
Family Income Brackets in Betsy Layne
According to the Betsy Layne family income data, there are 92 families falling into the $50,000 to $74,999 income range, which is the most common income bracket and makes up 40.2% of all families.
| Income Bracket | # Families | % Families |
| Less than $10,000 | 0 | 0.0% |
| $10,000 to $14,999 | 22 | 9.6% |
| $15,000 to $24,999 | 0 | 0.0% |
| $25,000 to $34,999 | 90 | 39.3% |
| $35,000 to $49,999 | 0 | 0.0% |
| $50,000 to $74,999 | 92 | 40.2% |
| $75,000 to $99,999 | 0 | 0.0% |
| $100,000 to $149,999 | 0 | 0.0% |
| $150,000 to $199,999 | 14 | 6.1% |
| $200,000+ | 11 | 4.8% |
Family Income by Famaliy Size in Betsy Layne
| Income Bracket | # Families | Median Income |
| 2-Person Families | 131 (57.2%) | $0 |
| 3-Person Families | 55 (24.0%) | $0 |
| 4-Person Families | 43 (18.8%) | $0 |
| 5-Person Families | 0 (0.0%) | $0 |
| 6-Person Families | 0 (0.0%) | $0 |
| 7+ Person Families | 0 (0.0%) | $0 |
| Total | 229 (100.0%) | $0 |
Family Income by Number of Earners in Betsy Layne
| Number of Earners | # Families | Median Income |
| No Earners | 183 (79.9%) | $0 |
| 1 Earner | 11 (4.8%) | $0 |
| 2 Earners | 14 (6.1%) | $0 |
| 3+ Earners | 21 (9.2%) | $0 |
| Total | 229 (100.0%) | $0 |
Household Income in Betsy Layne
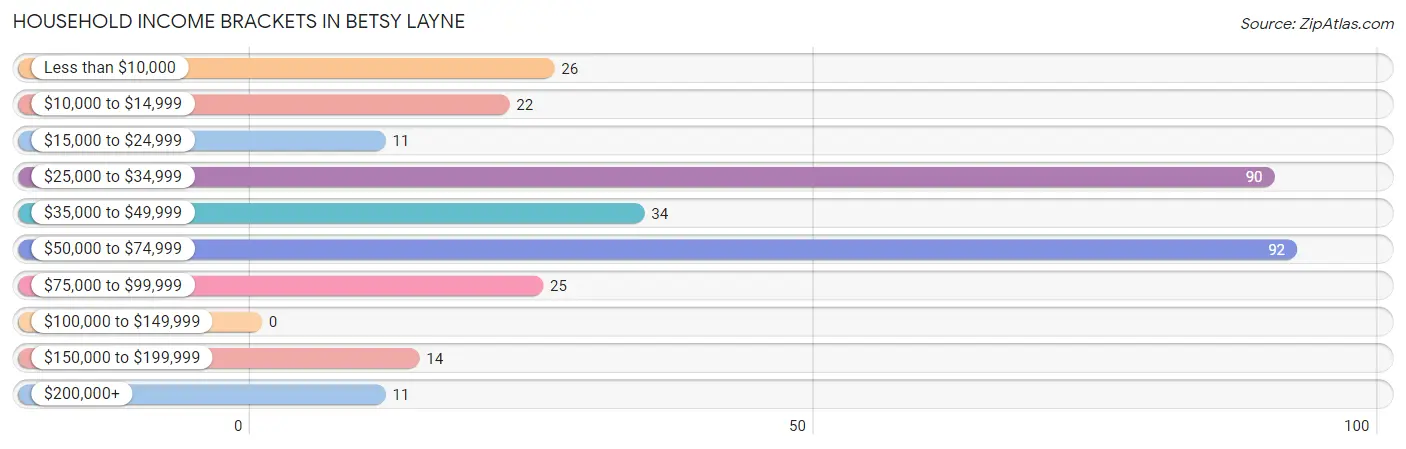
Household Income Brackets in Betsy Layne
With 92 households falling in the category, the $50,000 to $74,999 income range is the most frequent in Betsy Layne, accounting for 28.3% of all households.
| Income Bracket | # Households | % Households |
| Less than $10,000 | 26 | 8.0% |
| $10,000 to $14,999 | 22 | 6.8% |
| $15,000 to $24,999 | 11 | 3.4% |
| $25,000 to $34,999 | 90 | 27.7% |
| $35,000 to $49,999 | 34 | 10.5% |
| $50,000 to $74,999 | 92 | 28.3% |
| $75,000 to $99,999 | 25 | 7.7% |
| $100,000 to $149,999 | 0 | 0.0% |
| $150,000 to $199,999 | 14 | 4.3% |
| $200,000+ | 11 | 3.4% |
Household Income by Householder Age in Betsy Layne
The median household income in Betsy Layne is $43,493, with the highest median household income of $85,150 found in the 45 to 64 years age bracket for the primary householder. A total of 97 households (29.8%) fall into this category.
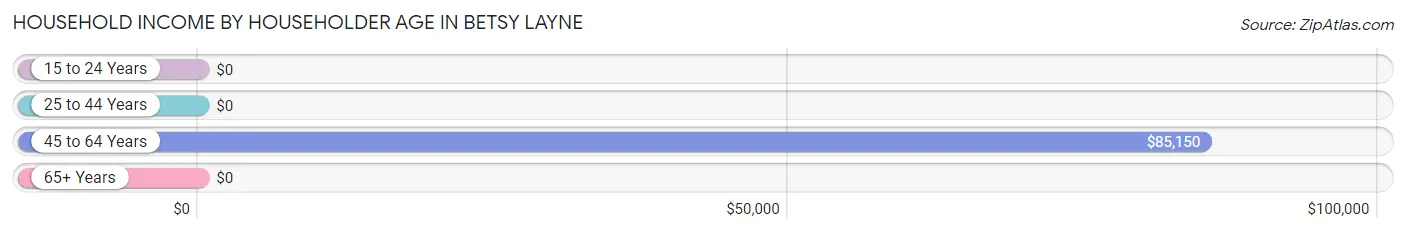
| Income Bracket | # Households | Median Income |
| 15 to 24 Years | 0 (0.0%) | $0 |
| 25 to 44 Years | 34 (10.5%) | $0 |
| 45 to 64 Years | 97 (29.8%) | $85,150 |
| 65+ Years | 194 (59.7%) | $0 |
| Total | 325 (100.0%) | $43,493 |
Poverty in Betsy Layne
Income Below Poverty by Sex and Age in Betsy Layne
With 23.0% poverty level for males and 12.3% for females among the residents of Betsy Layne, 12 to 14 year old males and 12 to 14 year old females are the most vulnerable to poverty, with 18 males (100.0%) and 24 females (44.4%) in their respective age groups living below the poverty level.
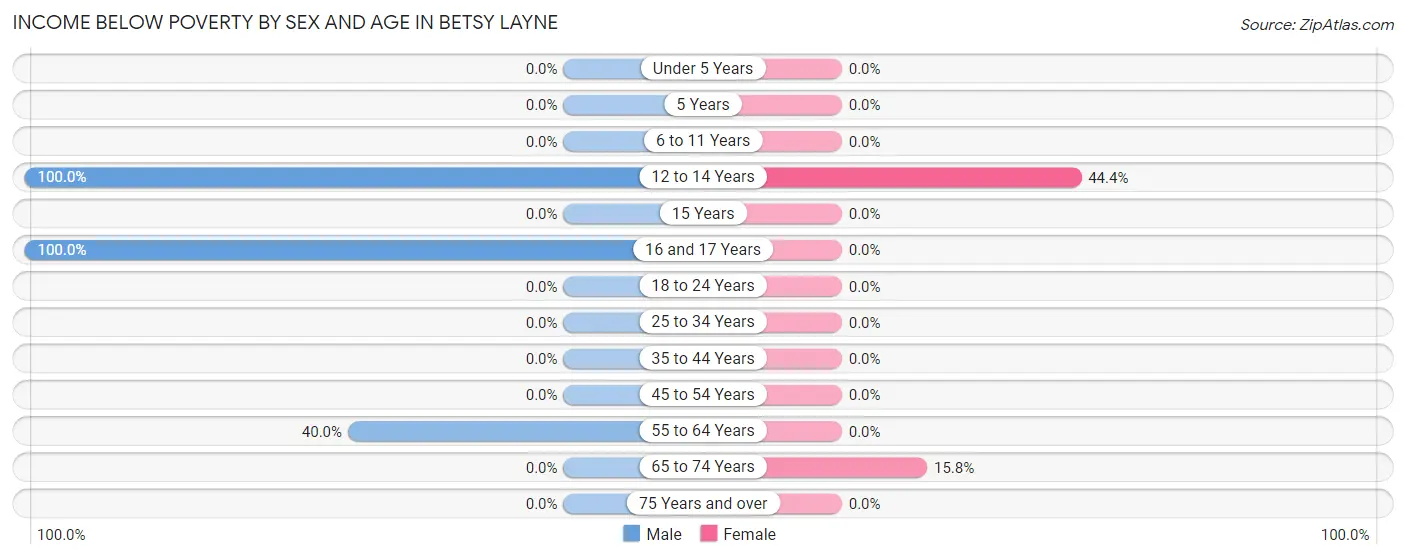
| Age Bracket | Male | Female |
| Under 5 Years | 0 (0.0%) | 0 (0.0%) |
| 5 Years | 0 (0.0%) | 0 (0.0%) |
| 6 to 11 Years | 0 (0.0%) | 0 (0.0%) |
| 12 to 14 Years | 18 (100.0%) | 24 (44.4%) |
| 15 Years | 0 (0.0%) | 0 (0.0%) |
| 16 and 17 Years | 22 (100.0%) | 0 (0.0%) |
| 18 to 24 Years | 0 (0.0%) | 0 (0.0%) |
| 25 to 34 Years | 0 (0.0%) | 0 (0.0%) |
| 35 to 44 Years | 0 (0.0%) | 0 (0.0%) |
| 45 to 54 Years | 0 (0.0%) | 0 (0.0%) |
| 55 to 64 Years | 26 (40.0%) | 0 (0.0%) |
| 65 to 74 Years | 0 (0.0%) | 22 (15.8%) |
| 75 Years and over | 0 (0.0%) | 0 (0.0%) |
| Total | 66 (23.0%) | 46 (12.3%) |
Income Above Poverty by Sex and Age in Betsy Layne
According to the poverty statistics in Betsy Layne, males aged 25 to 34 years and females aged 15 years are the age groups that are most secure financially, with 100.0% of males and 100.0% of females in these age groups living above the poverty line.
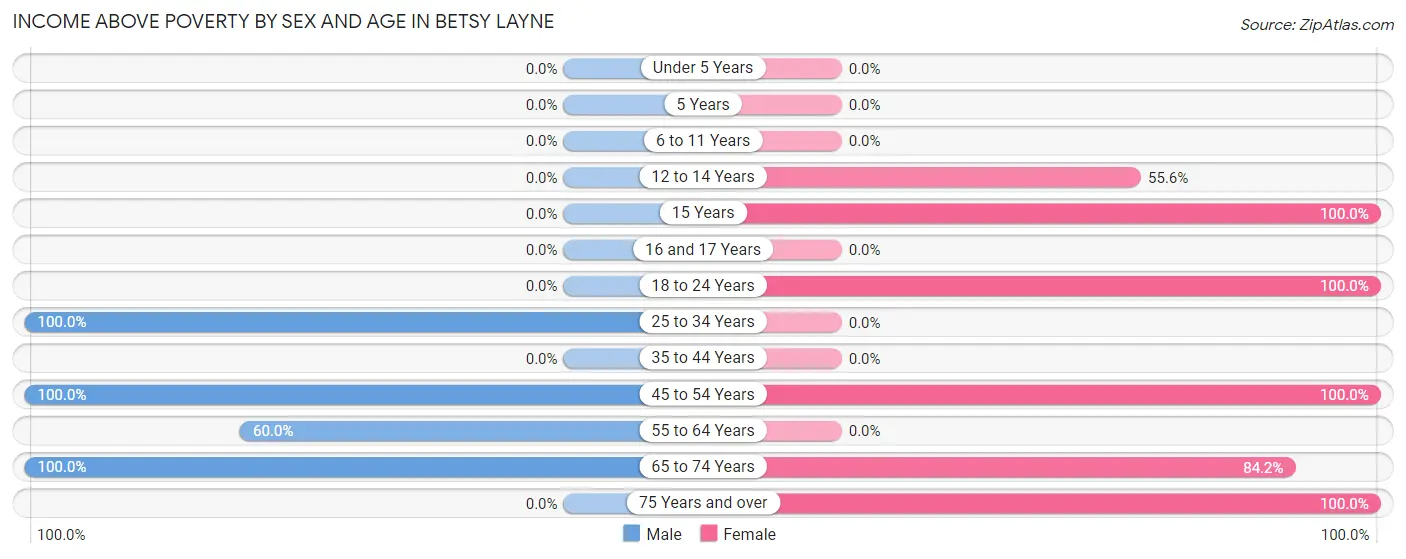
| Age Bracket | Male | Female |
| Under 5 Years | 0 (0.0%) | 0 (0.0%) |
| 5 Years | 0 (0.0%) | 0 (0.0%) |
| 6 to 11 Years | 0 (0.0%) | 0 (0.0%) |
| 12 to 14 Years | 0 (0.0%) | 30 (55.6%) |
| 15 Years | 0 (0.0%) | 10 (100.0%) |
| 16 and 17 Years | 0 (0.0%) | 0 (0.0%) |
| 18 to 24 Years | 0 (0.0%) | 26 (100.0%) |
| 25 to 34 Years | 34 (100.0%) | 0 (0.0%) |
| 35 to 44 Years | 0 (0.0%) | 0 (0.0%) |
| 45 to 54 Years | 54 (100.0%) | 77 (100.0%) |
| 55 to 64 Years | 39 (60.0%) | 0 (0.0%) |
| 65 to 74 Years | 94 (100.0%) | 117 (84.2%) |
| 75 Years and over | 0 (0.0%) | 69 (100.0%) |
| Total | 221 (77.0%) | 329 (87.7%) |
Income Below Poverty Among Married-Couple Families in Betsy Layne
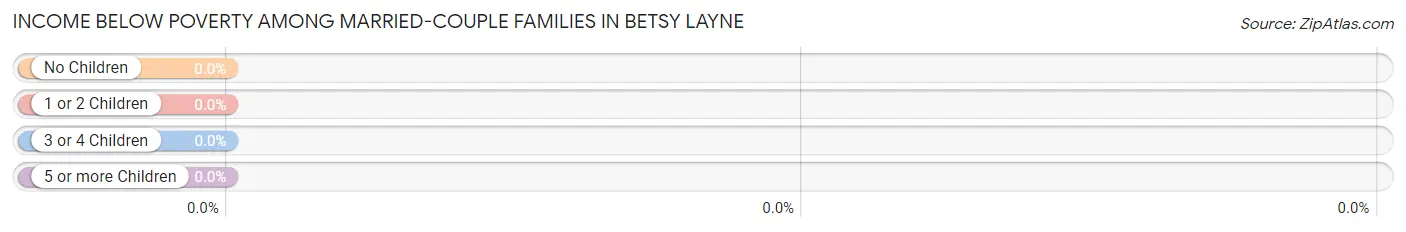
| Children | Above Poverty | Below Poverty |
| No Children | 131 (100.0%) | 0 (0.0%) |
| 1 or 2 Children | 21 (100.0%) | 0 (0.0%) |
| 3 or 4 Children | 0 (0.0%) | 0 (0.0%) |
| 5 or more Children | 0 (0.0%) | 0 (0.0%) |
| Total | 152 (100.0%) | 0 (0.0%) |
Income Below Poverty Among Single-Parent Households in Betsy Layne
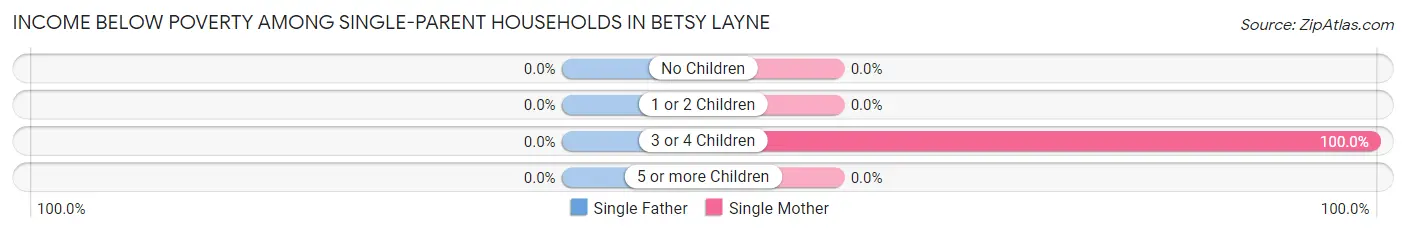
| Children | Single Father | Single Mother |
| No Children | 0 (0.0%) | 0 (0.0%) |
| 1 or 2 Children | 0 (0.0%) | 0 (0.0%) |
| 3 or 4 Children | 0 (0.0%) | 22 (100.0%) |
| 5 or more Children | 0 (0.0%) | 0 (0.0%) |
| Total | 0 (0.0%) | 22 (28.6%) |
Income Below Poverty Among Married-Couple vs Single-Parent Households in Betsy Layne
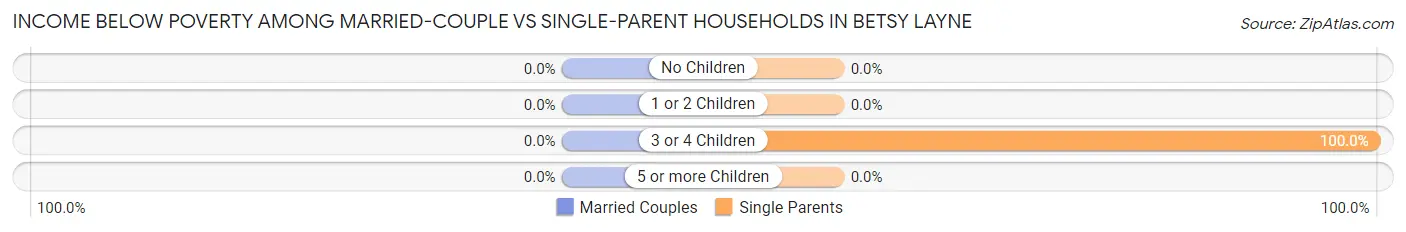
| Children | Married-Couple Families | Single-Parent Households |
| No Children | 0 (0.0%) | 0 (0.0%) |
| 1 or 2 Children | 0 (0.0%) | 0 (0.0%) |
| 3 or 4 Children | 0 (0.0%) | 22 (100.0%) |
| 5 or more Children | 0 (0.0%) | 0 (0.0%) |
| Total | 0 (0.0%) | 22 (28.6%) |
Race in Betsy Layne
The most populous races in Betsy Layne are , and White / Caucasian (662 | 100.0%).
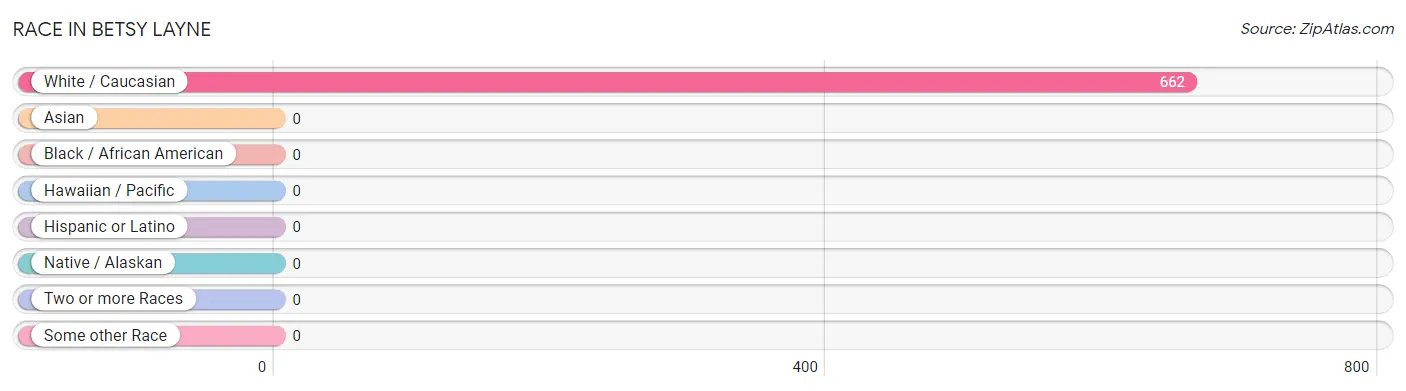
| Race | # Population | % Population |
| Asian | 0 | 0.0% |
| Black / African American | 0 | 0.0% |
| Hawaiian / Pacific | 0 | 0.0% |
| Hispanic or Latino | 0 | 0.0% |
| Native / Alaskan | 0 | 0.0% |
| White / Caucasian | 662 | 100.0% |
| Two or more Races | 0 | 0.0% |
| Some other Race | 0 | 0.0% |
| Total | 662 | 100.0% |
Ancestry in Betsy Layne
The most populous ancestries reported in Betsy Layne are Irish (164 | 24.8%), American (129 | 19.5%), English (90 | 13.6%), and German (35 | 5.3%), together accounting for 63.1% of all Betsy Layne residents.
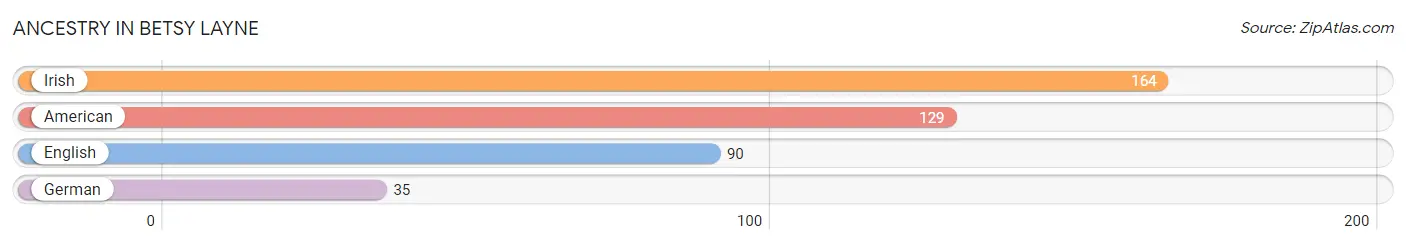
| Ancestry | # Population | % Population |
| American | 129 | 19.5% |
| English | 90 | 13.6% |
| German | 35 | 5.3% |
| Irish | 164 | 24.8% | View All 4 Rows |
Immigrants in Betsy Layne

| Immigration Origin | # Population | % Population | View All 0 Rows |
Sex and Age in Betsy Layne
Sex and Age in Betsy Layne
The most populous age groups in Betsy Layne are 65 to 69 Years (94 | 32.8%) for men and 70 to 74 Years (112 | 29.9%) for women.
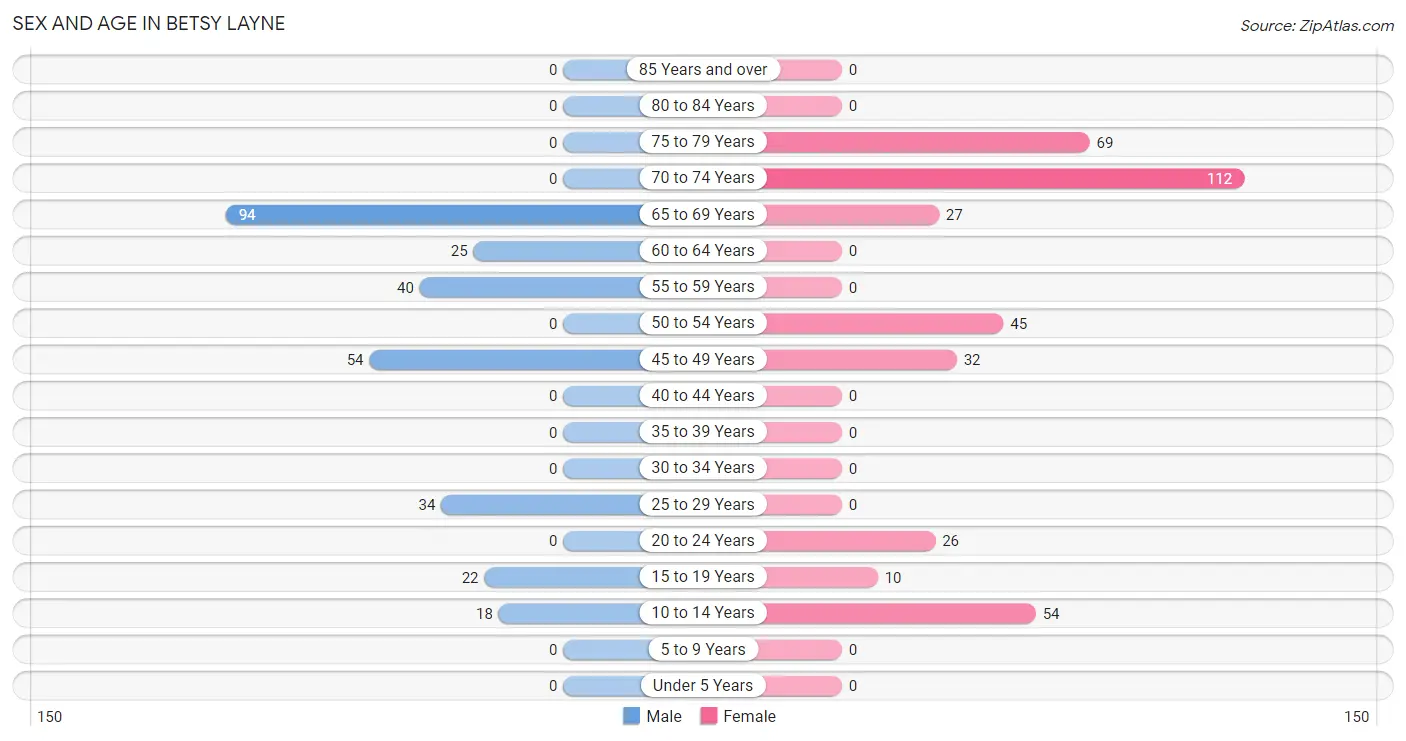
| Age Bracket | Male | Female |
| Under 5 Years | 0 (0.0%) | 0 (0.0%) |
| 5 to 9 Years | 0 (0.0%) | 0 (0.0%) |
| 10 to 14 Years | 18 (6.3%) | 54 (14.4%) |
| 15 to 19 Years | 22 (7.7%) | 10 (2.7%) |
| 20 to 24 Years | 0 (0.0%) | 26 (6.9%) |
| 25 to 29 Years | 34 (11.8%) | 0 (0.0%) |
| 30 to 34 Years | 0 (0.0%) | 0 (0.0%) |
| 35 to 39 Years | 0 (0.0%) | 0 (0.0%) |
| 40 to 44 Years | 0 (0.0%) | 0 (0.0%) |
| 45 to 49 Years | 54 (18.8%) | 32 (8.5%) |
| 50 to 54 Years | 0 (0.0%) | 45 (12.0%) |
| 55 to 59 Years | 40 (13.9%) | 0 (0.0%) |
| 60 to 64 Years | 25 (8.7%) | 0 (0.0%) |
| 65 to 69 Years | 94 (32.8%) | 27 (7.2%) |
| 70 to 74 Years | 0 (0.0%) | 112 (29.9%) |
| 75 to 79 Years | 0 (0.0%) | 69 (18.4%) |
| 80 to 84 Years | 0 (0.0%) | 0 (0.0%) |
| 85 Years and over | 0 (0.0%) | 0 (0.0%) |
| Total | 287 (100.0%) | 375 (100.0%) |
Families and Households in Betsy Layne
Median Family Size in Betsy Layne
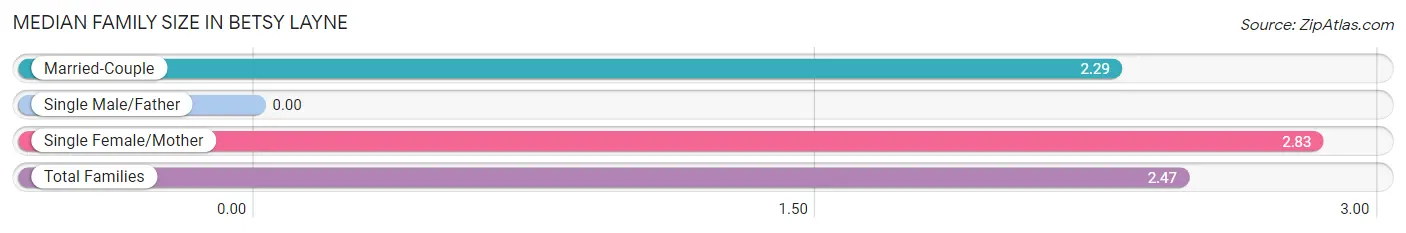
| Family Type | # Families | Family Size |
| Married-Couple | 152 (66.4%) | 2.29 |
| Single Male/Father | 0 (0.0%) | - |
| Single Female/Mother | 77 (33.6%) | 2.83 |
| Total Families | 229 (100.0%) | 2.47 |
Median Household Size in Betsy Layne
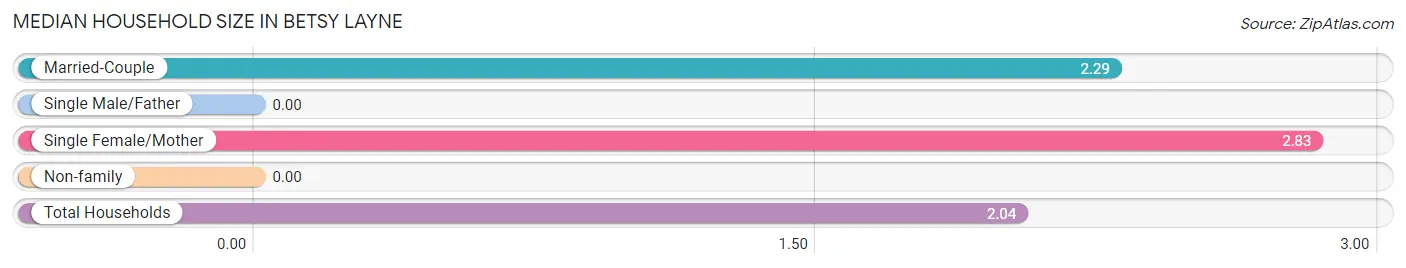
| Household Type | # Households | Household Size |
| Married-Couple | 152 (46.8%) | 2.29 |
| Single Male/Father | 0 (0.0%) | - |
| Single Female/Mother | 77 (23.7%) | 2.83 |
| Non-family | 96 (29.5%) | - |
| Total Households | 325 (100.0%) | 2.04 |
Household Size by Marriage Status in Betsy Layne
Out of a total of 325 households in Betsy Layne, 229 (70.5%) are family households, while 96 (29.5%) are nonfamily households. The most numerous type of family households are 2-person households, comprising 131, and the most common type of nonfamily households are 1-person households, comprising 96.
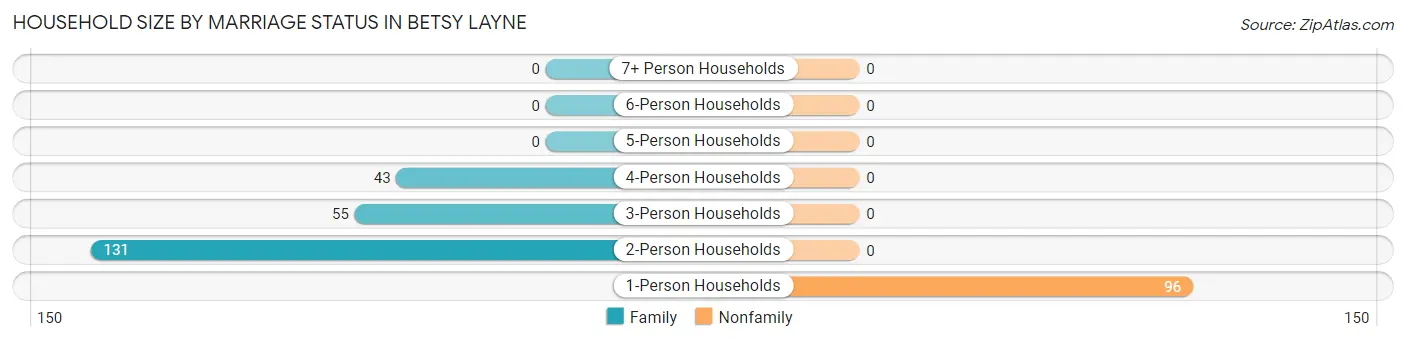
| Household Size | Family Households | Nonfamily Households |
| 1-Person Households | - | 96 (29.5%) |
| 2-Person Households | 131 (40.3%) | 0 (0.0%) |
| 3-Person Households | 55 (16.9%) | 0 (0.0%) |
| 4-Person Households | 43 (13.2%) | 0 (0.0%) |
| 5-Person Households | 0 (0.0%) | 0 (0.0%) |
| 6-Person Households | 0 (0.0%) | 0 (0.0%) |
| 7+ Person Households | 0 (0.0%) | 0 (0.0%) |
| Total | 229 (70.5%) | 96 (29.5%) |
Female Fertility in Betsy Layne
Fertility by Age in Betsy Layne
| Age Bracket | Women with Births | Births / 1,000 Women |
| 15 to 19 years | 0 (0.0%) | 0.0 |
| 20 to 34 years | 0 (0.0%) | 0.0 |
| 35 to 50 years | 0 (0.0%) | 0.0 |
| Total | 0 (0.0%) | 0.0 |
Fertility by Age by Marriage Status in Betsy Layne
| Age Bracket | Married | Unmarried |
| 15 to 19 years | 0 (0.0%) | 0 (0.0%) |
| 20 to 34 years | 0 (0.0%) | 0 (0.0%) |
| 35 to 50 years | 0 (0.0%) | 0 (0.0%) |
| Total | 0 (0.0%) | 0 (0.0%) |
Fertility by Education in Betsy Layne
| Educational Attainment | Women with Births | Births / 1,000 Women |
| Less than High School | 0 (0.0%) | 0.0 |
| High School Diploma | 0 (0.0%) | 0.0 |
| College or Associate's Degree | 0 (0.0%) | 0.0 |
| Bachelor's Degree | 0 (0.0%) | 0.0 |
| Graduate Degree | 0 (0.0%) | 0.0 |
| Total | 0 (0.0%) | 0.0 |
Fertility by Education by Marriage Status in Betsy Layne
| Educational Attainment | Married | Unmarried |
| Less than High School | 0 (0.0%) | 0 (0.0%) |
| High School Diploma | 0 (0.0%) | 0 (0.0%) |
| College or Associate's Degree | 0 (0.0%) | 0 (0.0%) |
| Bachelor's Degree | 0 (0.0%) | 0 (0.0%) |
| Graduate Degree | 0 (0.0%) | 0 (0.0%) |
| Total | 0 (0.0%) | 0 (0.0%) |
Employment Characteristics in Betsy Layne
Employment by Class of Employer in Betsy Layne
Among the 203 employed individuals in Betsy Layne, private company employees (111 | 54.7%), not-for-profit organizations (58 | 28.6%), and state government employees (34 | 16.8%) make up the most common classes of employment.
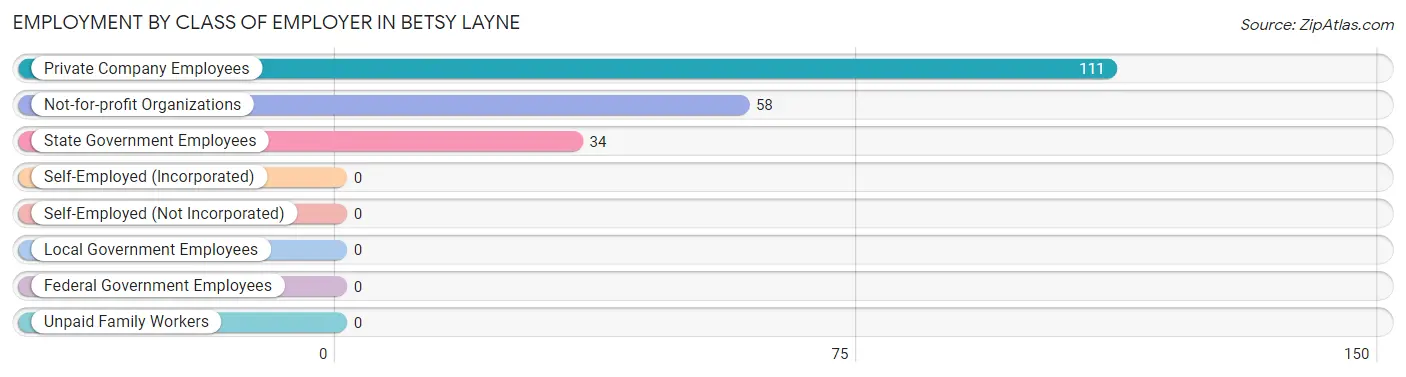
| Employer Class | # Employees | % Employees |
| Private Company Employees | 111 | 54.7% |
| Self-Employed (Incorporated) | 0 | 0.0% |
| Self-Employed (Not Incorporated) | 0 | 0.0% |
| Not-for-profit Organizations | 58 | 28.6% |
| Local Government Employees | 0 | 0.0% |
| State Government Employees | 34 | 16.8% |
| Federal Government Employees | 0 | 0.0% |
| Unpaid Family Workers | 0 | 0.0% |
| Total | 203 | 100.0% |
Employment Status by Age in Betsy Layne
According to the labor force statistics for Betsy Layne, out of the total population over 16 years of age (580), 38.8% or 225 individuals are in the labor force, with 9.8% or 22 of them unemployed. The age group with the highest labor force participation rate is 16 to 19 years, with 100.0% or 22 individuals in the labor force. Within the labor force, the 16 to 19 years age range has the highest percentage of unemployed individuals, with 100.0% or 22 of them being unemployed.
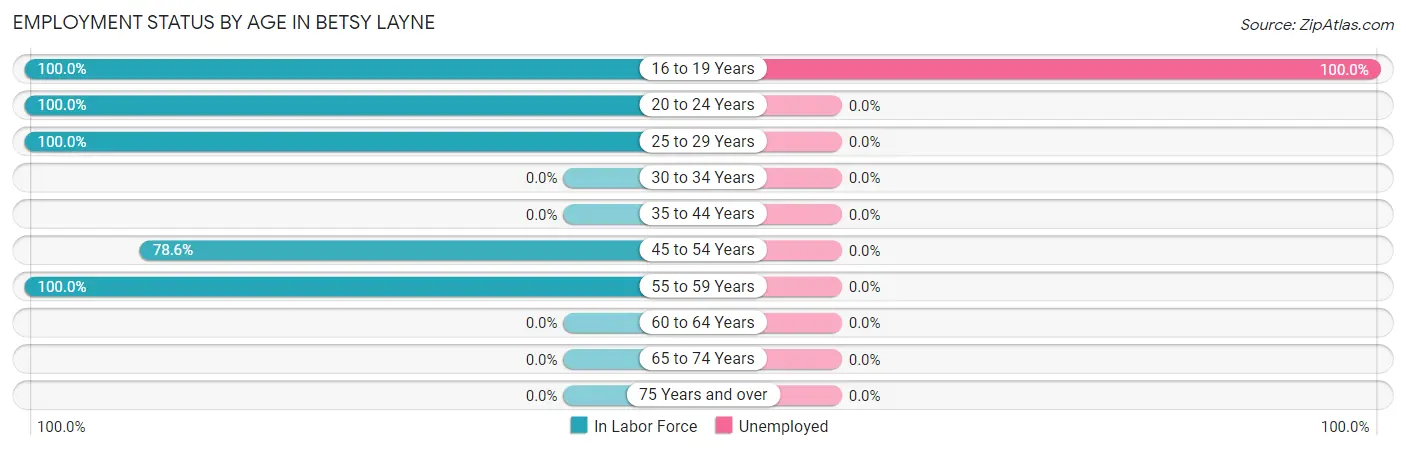
| Age Bracket | In Labor Force | Unemployed |
| 16 to 19 Years | 22 (100.0%) | 22 (100.0%) |
| 20 to 24 Years | 26 (100.0%) | 0 (0.0%) |
| 25 to 29 Years | 34 (100.0%) | 0 (0.0%) |
| 30 to 34 Years | 0 (0.0%) | 0 (0.0%) |
| 35 to 44 Years | 0 (0.0%) | 0 (0.0%) |
| 45 to 54 Years | 103 (78.6%) | 0 (0.0%) |
| 55 to 59 Years | 40 (100.0%) | 0 (0.0%) |
| 60 to 64 Years | 0 (0.0%) | 0 (0.0%) |
| 65 to 74 Years | 0 (0.0%) | 0 (0.0%) |
| 75 Years and over | 0 (0.0%) | 0 (0.0%) |
| Total | 225 (38.8%) | 22 (9.8%) |
Employment Status by Educational Attainment in Betsy Layne
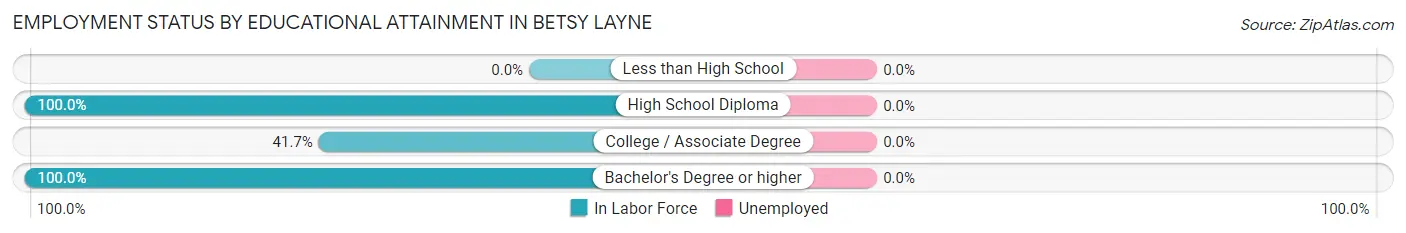
| Educational Attainment | In Labor Force | Unemployed |
| Less than High School | 0 (0.0%) | 0 (0.0%) |
| High School Diploma | 61 (100.0%) | 0 (0.0%) |
| College / Associate Degree | 20 (41.7%) | 0 (0.0%) |
| Bachelor's Degree or higher | 96 (100.0%) | 0 (0.0%) |
| Total | 177 (77.0%) | 0 (0.0%) |
Employment Occupations by Sex in Betsy Layne
Management, Business, Science and Arts Occupations
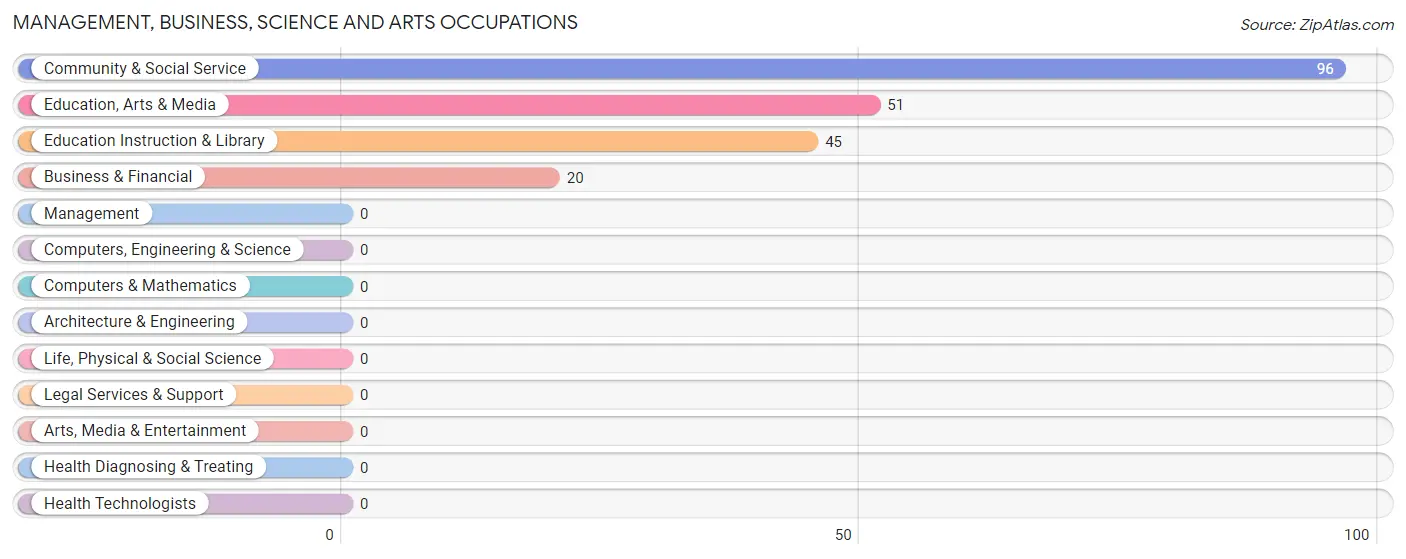
The most common Management, Business, Science and Arts occupations in Betsy Layne are Community & Social Service (96 | 47.3%), Education, Arts & Media (51 | 25.1%), Education Instruction & Library (45 | 22.2%), and Business & Financial (20 | 9.9%).
Management, Business, Science and Arts Occupations by Sex
Within the Management, Business, Science and Arts occupations in Betsy Layne, the most male-oriented occupations are Education Instruction & Library (75.6%), Community & Social Service (62.5%), and Education, Arts & Media (51.0%), while the most female-oriented occupations are Business & Financial (100.0%), Education, Arts & Media (49.0%), and Community & Social Service (37.5%).
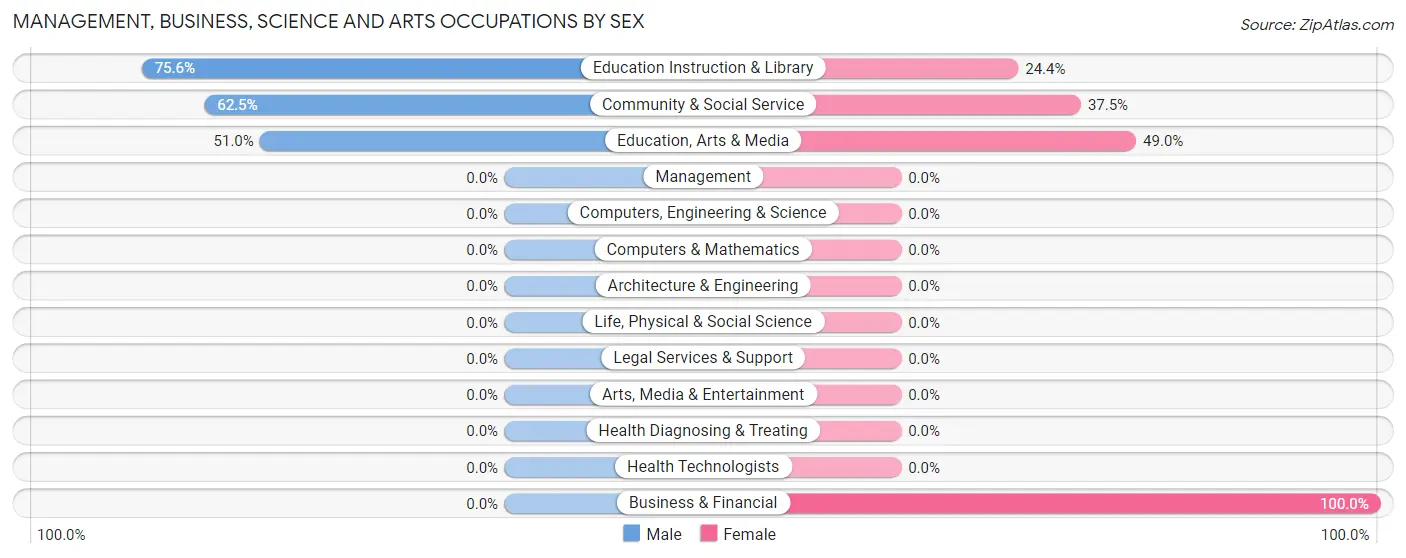
| Occupation | Male | Female |
| Management | 0 (0.0%) | 0 (0.0%) |
| Business & Financial | 0 (0.0%) | 20 (100.0%) |
| Computers, Engineering & Science | 0 (0.0%) | 0 (0.0%) |
| Computers & Mathematics | 0 (0.0%) | 0 (0.0%) |
| Architecture & Engineering | 0 (0.0%) | 0 (0.0%) |
| Life, Physical & Social Science | 0 (0.0%) | 0 (0.0%) |
| Community & Social Service | 60 (62.5%) | 36 (37.5%) |
| Education, Arts & Media | 26 (51.0%) | 25 (49.0%) |
| Legal Services & Support | 0 (0.0%) | 0 (0.0%) |
| Education Instruction & Library | 34 (75.6%) | 11 (24.4%) |
| Arts, Media & Entertainment | 0 (0.0%) | 0 (0.0%) |
| Health Diagnosing & Treating | 0 (0.0%) | 0 (0.0%) |
| Health Technologists | 0 (0.0%) | 0 (0.0%) |
| Total (Category) | 60 (51.7%) | 56 (48.3%) |
| Total (Overall) | 100 (49.3%) | 103 (50.7%) |
Services Occupations
Services Occupations by Sex
| Occupation | Male | Female |
| Healthcare Support | 0 (0.0%) | 0 (0.0%) |
| Security & Protection | 0 (0.0%) | 0 (0.0%) |
| Firefighting & Prevention | 0 (0.0%) | 0 (0.0%) |
| Law Enforcement | 0 (0.0%) | 0 (0.0%) |
| Food Preparation & Serving | 0 (0.0%) | 0 (0.0%) |
| Cleaning & Maintenance | 0 (0.0%) | 0 (0.0%) |
| Personal Care & Service | 0 (0.0%) | 0 (0.0%) |
| Total (Category) | 0 (0.0%) | 0 (0.0%) |
| Total (Overall) | 100 (49.3%) | 103 (50.7%) |
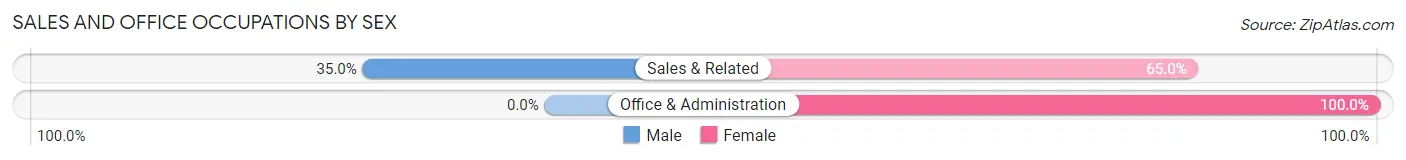
Sales and Office Occupations
The most common Sales and Office occupations in Betsy Layne are Sales & Related (40 | 19.7%), and Office & Administration (21 | 10.3%).
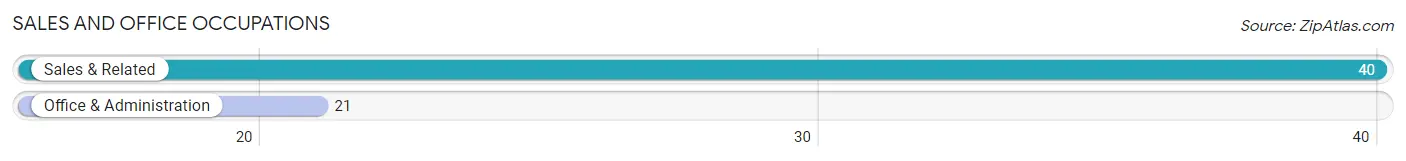
Sales and Office Occupations by Sex
| Occupation | Male | Female |
| Sales & Related | 14 (35.0%) | 26 (65.0%) |
| Office & Administration | 0 (0.0%) | 21 (100.0%) |
| Total (Category) | 14 (23.0%) | 47 (77.0%) |
| Total (Overall) | 100 (49.3%) | 103 (50.7%) |
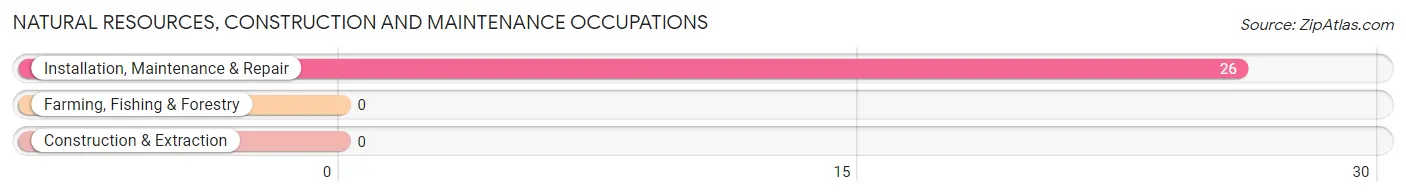
Natural Resources, Construction and Maintenance Occupations
The most common Natural Resources, Construction and Maintenance occupations in Betsy Layne are , and Installation, Maintenance & Repair (26 | 12.8%).
Natural Resources, Construction and Maintenance Occupations by Sex
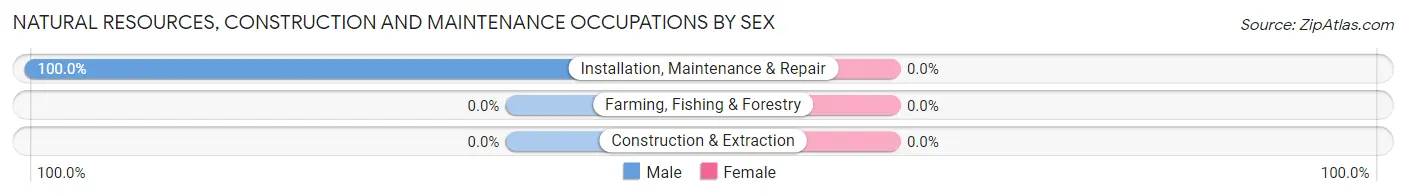
| Occupation | Male | Female |
| Farming, Fishing & Forestry | 0 (0.0%) | 0 (0.0%) |
| Construction & Extraction | 0 (0.0%) | 0 (0.0%) |
| Installation, Maintenance & Repair | 26 (100.0%) | 0 (0.0%) |
| Total (Category) | 26 (100.0%) | 0 (0.0%) |
| Total (Overall) | 100 (49.3%) | 103 (50.7%) |
Production, Transportation and Moving Occupations
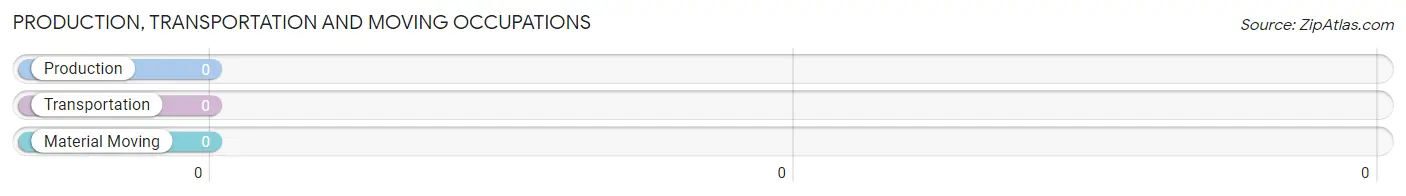
Production, Transportation and Moving Occupations by Sex
| Occupation | Male | Female |
| Production | 0 (0.0%) | 0 (0.0%) |
| Transportation | 0 (0.0%) | 0 (0.0%) |
| Material Moving | 0 (0.0%) | 0 (0.0%) |
| Total (Category) | 0 (0.0%) | 0 (0.0%) |
| Total (Overall) | 100 (49.3%) | 103 (50.7%) |
Employment Industries by Sex in Betsy Layne
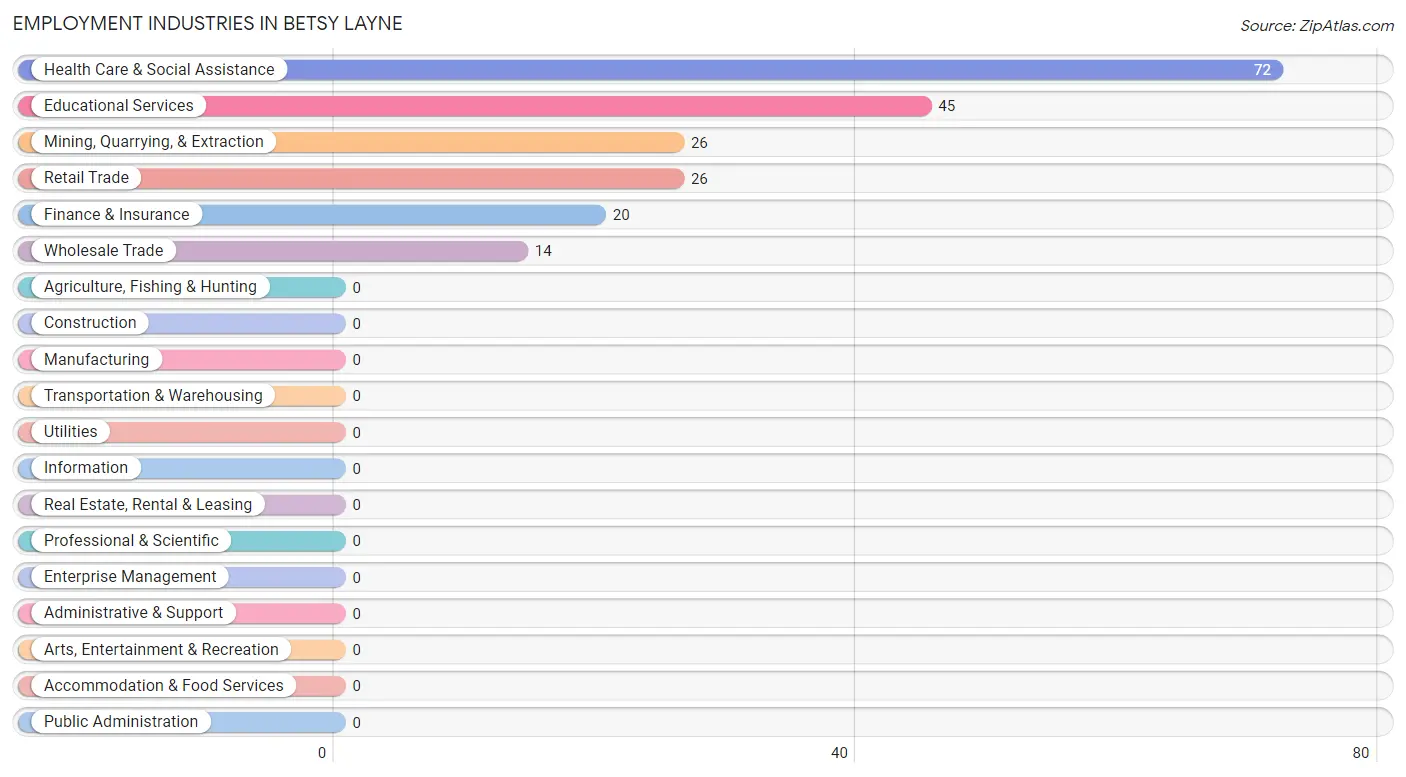
Employment Industries in Betsy Layne
The major employment industries in Betsy Layne include Health Care & Social Assistance (72 | 35.5%), Educational Services (45 | 22.2%), Mining, Quarrying, & Extraction (26 | 12.8%), Retail Trade (26 | 12.8%), and Finance & Insurance (20 | 9.9%).
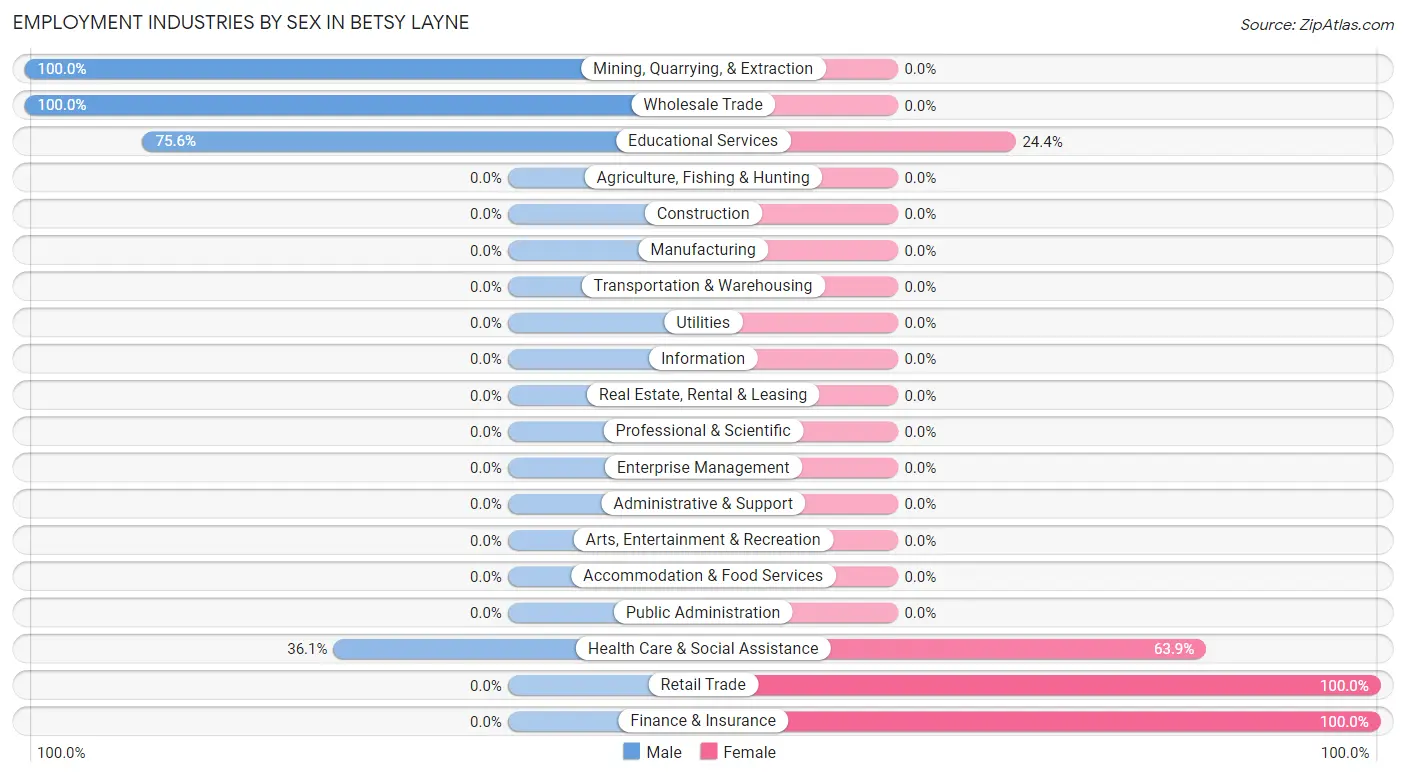
Employment Industries by Sex in Betsy Layne
The Betsy Layne industries that see more men than women are Mining, Quarrying, & Extraction (100.0%), Wholesale Trade (100.0%), and Educational Services (75.6%), whereas the industries that tend to have a higher number of women are Retail Trade (100.0%), Finance & Insurance (100.0%), and Health Care & Social Assistance (63.9%).
| Industry | Male | Female |
| Agriculture, Fishing & Hunting | 0 (0.0%) | 0 (0.0%) |
| Mining, Quarrying, & Extraction | 26 (100.0%) | 0 (0.0%) |
| Construction | 0 (0.0%) | 0 (0.0%) |
| Manufacturing | 0 (0.0%) | 0 (0.0%) |
| Wholesale Trade | 14 (100.0%) | 0 (0.0%) |
| Retail Trade | 0 (0.0%) | 26 (100.0%) |
| Transportation & Warehousing | 0 (0.0%) | 0 (0.0%) |
| Utilities | 0 (0.0%) | 0 (0.0%) |
| Information | 0 (0.0%) | 0 (0.0%) |
| Finance & Insurance | 0 (0.0%) | 20 (100.0%) |
| Real Estate, Rental & Leasing | 0 (0.0%) | 0 (0.0%) |
| Professional & Scientific | 0 (0.0%) | 0 (0.0%) |
| Enterprise Management | 0 (0.0%) | 0 (0.0%) |
| Administrative & Support | 0 (0.0%) | 0 (0.0%) |
| Educational Services | 34 (75.6%) | 11 (24.4%) |
| Health Care & Social Assistance | 26 (36.1%) | 46 (63.9%) |
| Arts, Entertainment & Recreation | 0 (0.0%) | 0 (0.0%) |
| Accommodation & Food Services | 0 (0.0%) | 0 (0.0%) |
| Public Administration | 0 (0.0%) | 0 (0.0%) |
| Total | 100 (49.3%) | 103 (50.7%) |
Education in Betsy Layne
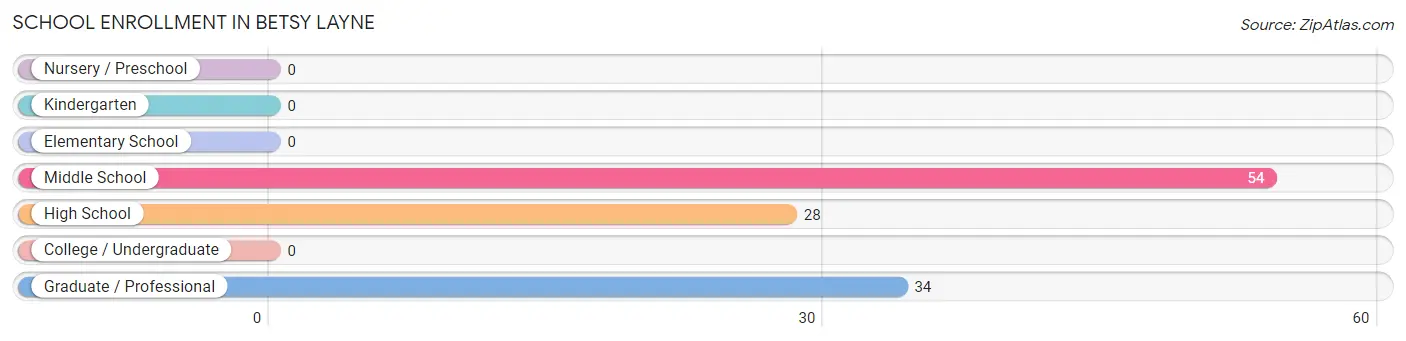
School Enrollment in Betsy Layne
The most common levels of schooling among the 116 students in Betsy Layne are middle school (54 | 46.6%), graduate / professional (34 | 29.3%), and high school (28 | 24.1%).
| School Level | # Students | % Students |
| Nursery / Preschool | 0 | 0.0% |
| Kindergarten | 0 | 0.0% |
| Elementary School | 0 | 0.0% |
| Middle School | 54 | 46.6% |
| High School | 28 | 24.1% |
| College / Undergraduate | 0 | 0.0% |
| Graduate / Professional | 34 | 29.3% |
| Total | 116 | 100.0% |
School Enrollment by Age by Funding Source in Betsy Layne
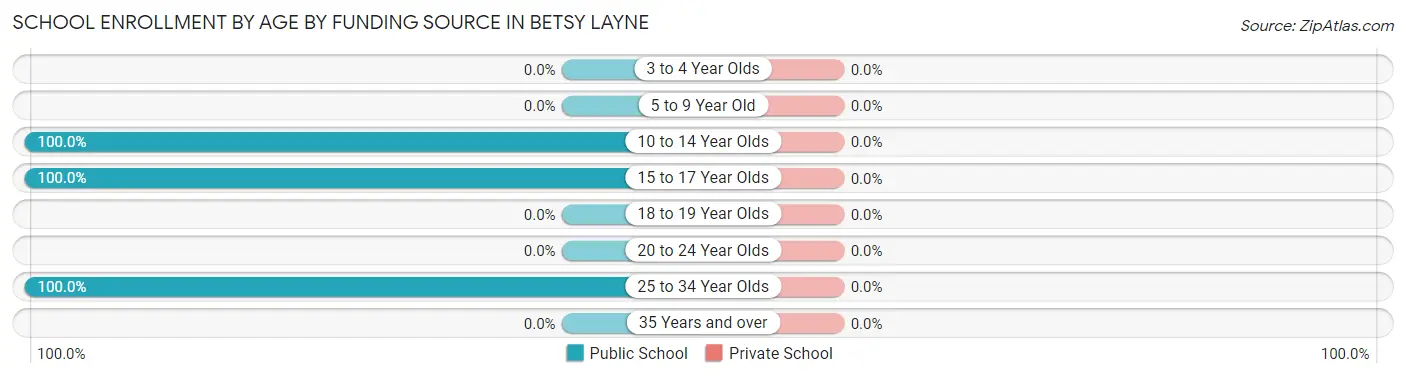
| Age Bracket | Public School | Private School |
| 3 to 4 Year Olds | 0 (0.0%) | 0 (0.0%) |
| 5 to 9 Year Old | 0 (0.0%) | 0 (0.0%) |
| 10 to 14 Year Olds | 72 (100.0%) | 0 (0.0%) |
| 15 to 17 Year Olds | 10 (100.0%) | 0 (0.0%) |
| 18 to 19 Year Olds | 0 (0.0%) | 0 (0.0%) |
| 20 to 24 Year Olds | 0 (0.0%) | 0 (0.0%) |
| 25 to 34 Year Olds | 34 (100.0%) | 0 (0.0%) |
| 35 Years and over | 0 (0.0%) | 0 (0.0%) |
| Total | 116 (100.0%) | 0 (0.0%) |
Educational Attainment by Field of Study in Betsy Layne
Psychology (51 | 46.4%), education (34 | 30.9%), business (14 | 12.7%), and bio, nature & agricultural (11 | 10.0%) are the most common fields of study among 110 individuals in Betsy Layne who have obtained a bachelor's degree or higher.
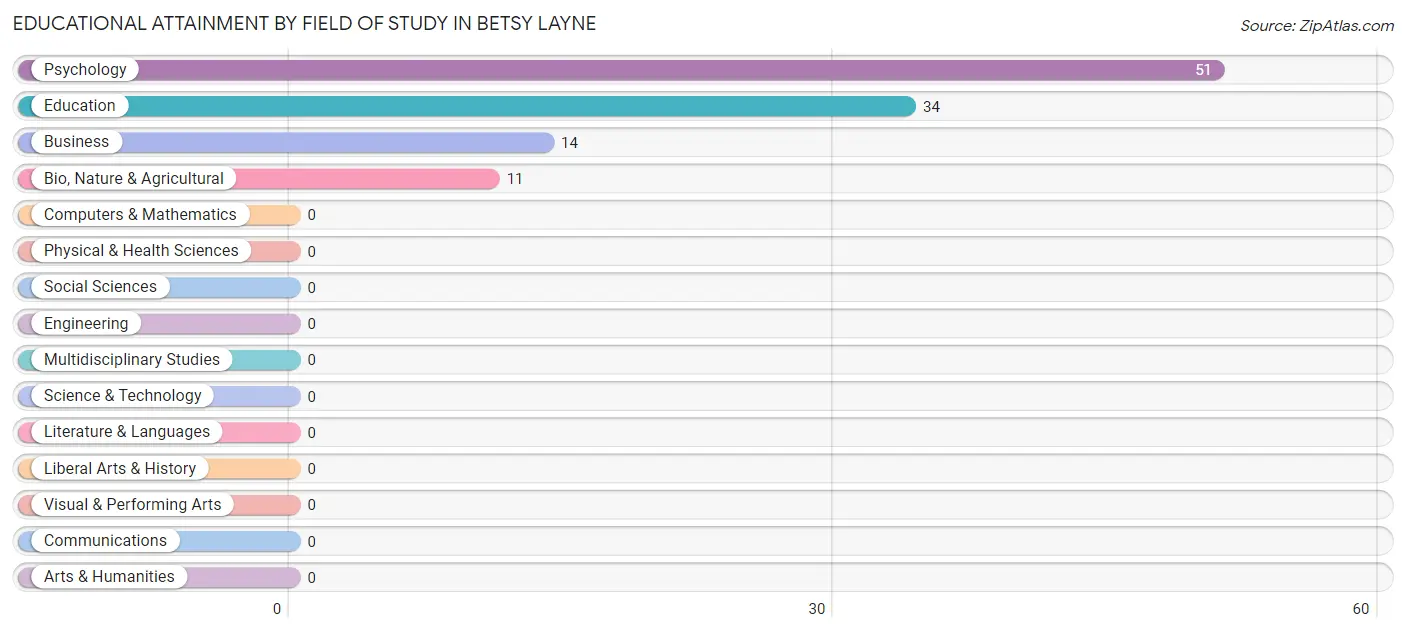
| Field of Study | # Graduates | % Graduates |
| Computers & Mathematics | 0 | 0.0% |
| Bio, Nature & Agricultural | 11 | 10.0% |
| Physical & Health Sciences | 0 | 0.0% |
| Psychology | 51 | 46.4% |
| Social Sciences | 0 | 0.0% |
| Engineering | 0 | 0.0% |
| Multidisciplinary Studies | 0 | 0.0% |
| Science & Technology | 0 | 0.0% |
| Business | 14 | 12.7% |
| Education | 34 | 30.9% |
| Literature & Languages | 0 | 0.0% |
| Liberal Arts & History | 0 | 0.0% |
| Visual & Performing Arts | 0 | 0.0% |
| Communications | 0 | 0.0% |
| Arts & Humanities | 0 | 0.0% |
| Total | 110 | 100.0% |
Transportation & Commute in Betsy Layne
Vehicle Availability by Sex in Betsy Layne
The most prevalent vehicle ownership categories in Betsy Layne are males with 1 vehicle (34, accounting for 34.0%) and females with 1 vehicle (0, making up 33.0%).
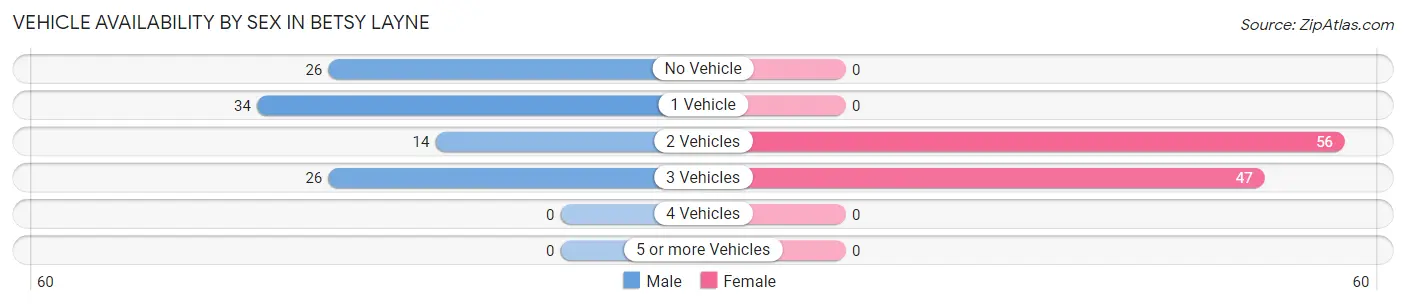
| Vehicles Available | Male | Female |
| No Vehicle | 26 (26.0%) | 0 (0.0%) |
| 1 Vehicle | 34 (34.0%) | 0 (0.0%) |
| 2 Vehicles | 14 (14.0%) | 56 (54.4%) |
| 3 Vehicles | 26 (26.0%) | 47 (45.6%) |
| 4 Vehicles | 0 (0.0%) | 0 (0.0%) |
| 5 or more Vehicles | 0 (0.0%) | 0 (0.0%) |
| Total | 100 (100.0%) | 103 (100.0%) |
Commute Time in Betsy Layne
The most frequently occuring commute durations in Betsy Layne are 15 to 19 minutes (119 commuters, 58.6%), 20 to 24 minutes (47 commuters, 23.2%), and 10 to 14 minutes (37 commuters, 18.2%).
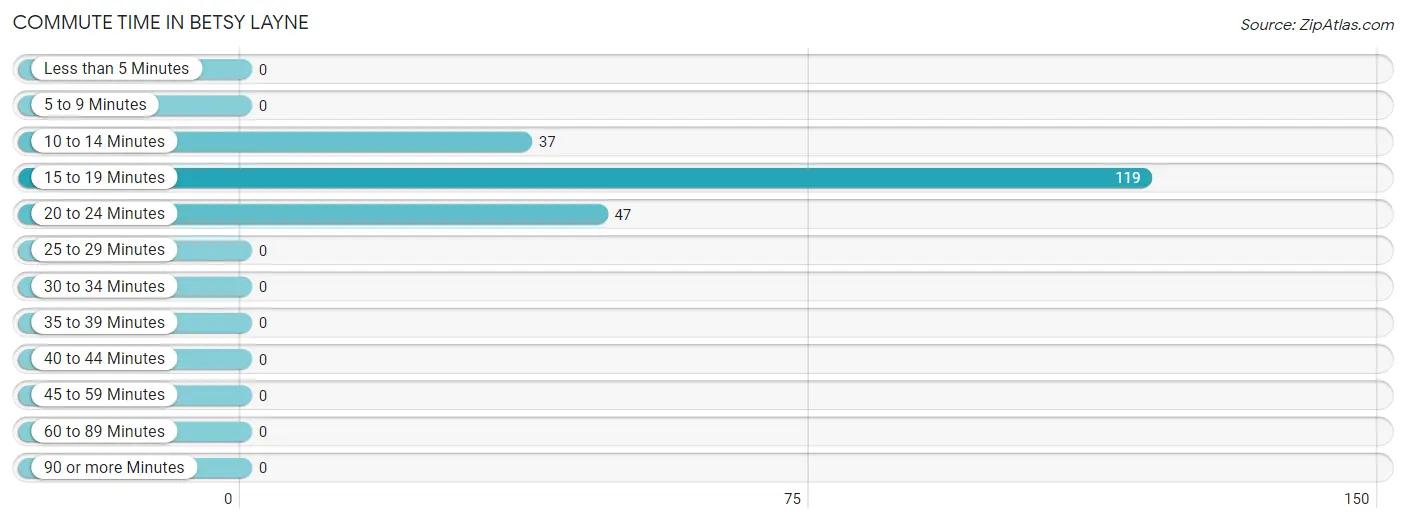
| Commute Time | # Commuters | % Commuters |
| Less than 5 Minutes | 0 | 0.0% |
| 5 to 9 Minutes | 0 | 0.0% |
| 10 to 14 Minutes | 37 | 18.2% |
| 15 to 19 Minutes | 119 | 58.6% |
| 20 to 24 Minutes | 47 | 23.2% |
| 25 to 29 Minutes | 0 | 0.0% |
| 30 to 34 Minutes | 0 | 0.0% |
| 35 to 39 Minutes | 0 | 0.0% |
| 40 to 44 Minutes | 0 | 0.0% |
| 45 to 59 Minutes | 0 | 0.0% |
| 60 to 89 Minutes | 0 | 0.0% |
| 90 or more Minutes | 0 | 0.0% |
Commute Time by Sex in Betsy Layne
The most common commute times in Betsy Layne are 15 to 19 minutes (48 commuters, 48.0%) for males and 15 to 19 minutes (71 commuters, 68.9%) for females.
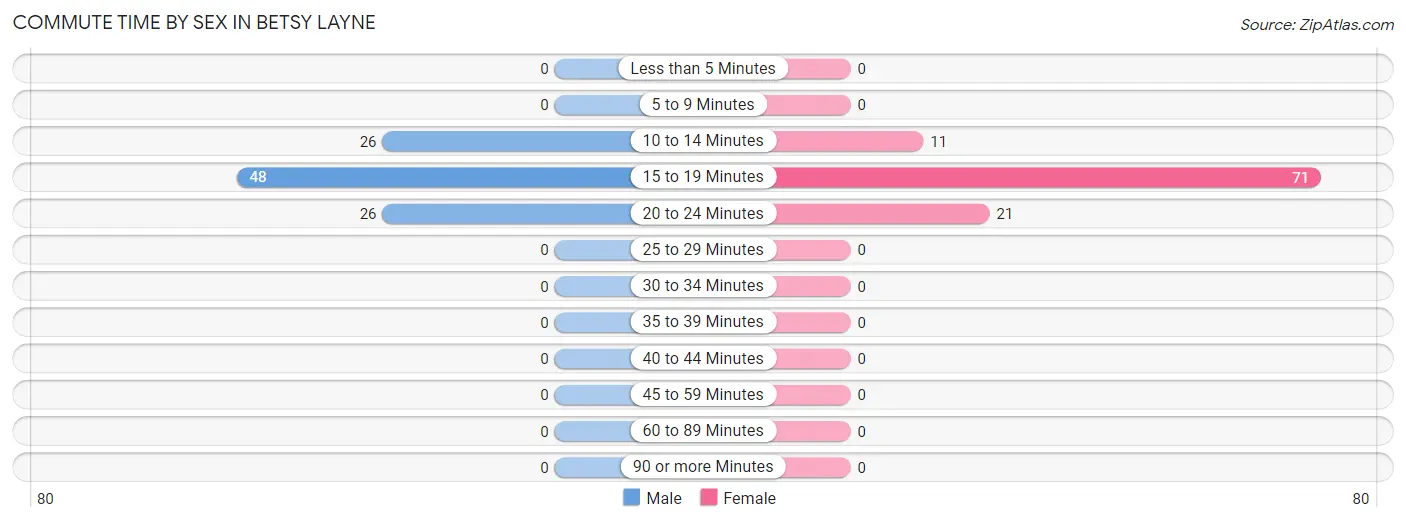
| Commute Time | Male | Female |
| Less than 5 Minutes | 0 (0.0%) | 0 (0.0%) |
| 5 to 9 Minutes | 0 (0.0%) | 0 (0.0%) |
| 10 to 14 Minutes | 26 (26.0%) | 11 (10.7%) |
| 15 to 19 Minutes | 48 (48.0%) | 71 (68.9%) |
| 20 to 24 Minutes | 26 (26.0%) | 21 (20.4%) |
| 25 to 29 Minutes | 0 (0.0%) | 0 (0.0%) |
| 30 to 34 Minutes | 0 (0.0%) | 0 (0.0%) |
| 35 to 39 Minutes | 0 (0.0%) | 0 (0.0%) |
| 40 to 44 Minutes | 0 (0.0%) | 0 (0.0%) |
| 45 to 59 Minutes | 0 (0.0%) | 0 (0.0%) |
| 60 to 89 Minutes | 0 (0.0%) | 0 (0.0%) |
| 90 or more Minutes | 0 (0.0%) | 0 (0.0%) |
Time of Departure to Work by Sex in Betsy Layne
The most frequent times of departure to work in Betsy Layne are 7:00 AM to 7:29 AM (60, 60.0%) for males and 7:30 AM to 7:59 AM (41, 39.8%) for females.
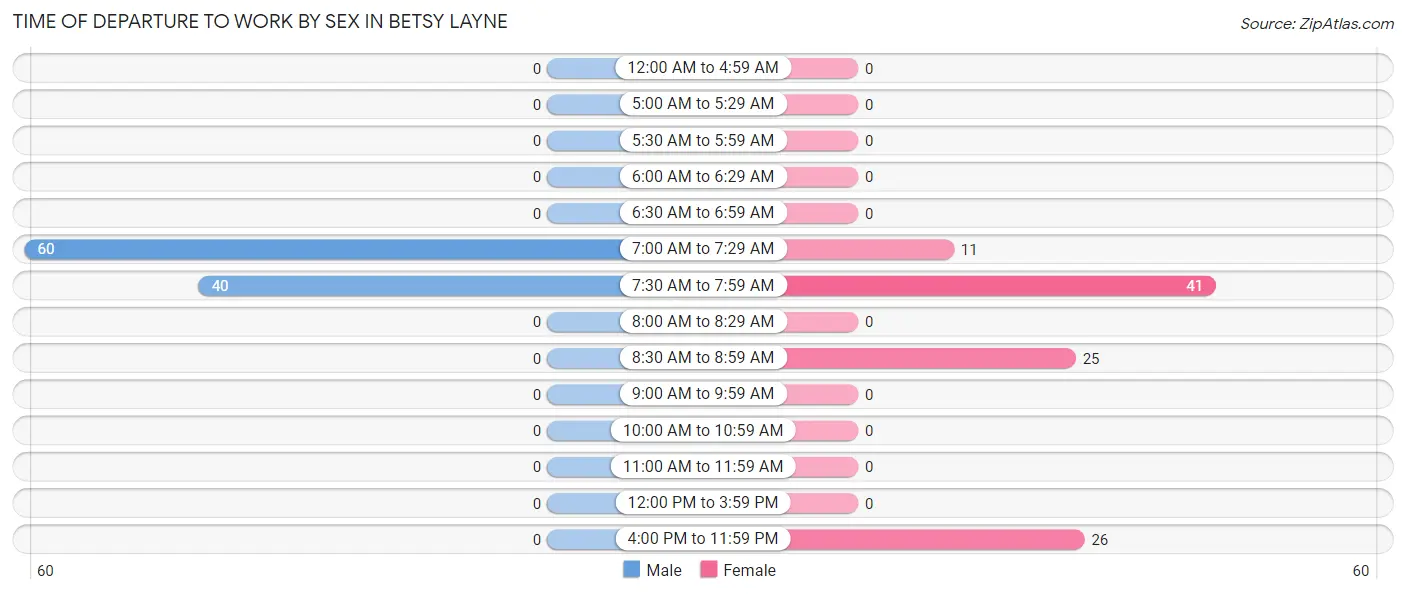
| Time of Departure | Male | Female |
| 12:00 AM to 4:59 AM | 0 (0.0%) | 0 (0.0%) |
| 5:00 AM to 5:29 AM | 0 (0.0%) | 0 (0.0%) |
| 5:30 AM to 5:59 AM | 0 (0.0%) | 0 (0.0%) |
| 6:00 AM to 6:29 AM | 0 (0.0%) | 0 (0.0%) |
| 6:30 AM to 6:59 AM | 0 (0.0%) | 0 (0.0%) |
| 7:00 AM to 7:29 AM | 60 (60.0%) | 11 (10.7%) |
| 7:30 AM to 7:59 AM | 40 (40.0%) | 41 (39.8%) |
| 8:00 AM to 8:29 AM | 0 (0.0%) | 0 (0.0%) |
| 8:30 AM to 8:59 AM | 0 (0.0%) | 25 (24.3%) |
| 9:00 AM to 9:59 AM | 0 (0.0%) | 0 (0.0%) |
| 10:00 AM to 10:59 AM | 0 (0.0%) | 0 (0.0%) |
| 11:00 AM to 11:59 AM | 0 (0.0%) | 0 (0.0%) |
| 12:00 PM to 3:59 PM | 0 (0.0%) | 0 (0.0%) |
| 4:00 PM to 11:59 PM | 0 (0.0%) | 26 (25.2%) |
| Total | 100 (100.0%) | 103 (100.0%) |
Housing Occupancy in Betsy Layne
Occupancy by Ownership in Betsy Layne
Of the total 325 dwellings in Betsy Layne, owner-occupied units account for 277 (85.2%), while renter-occupied units make up 48 (14.8%).
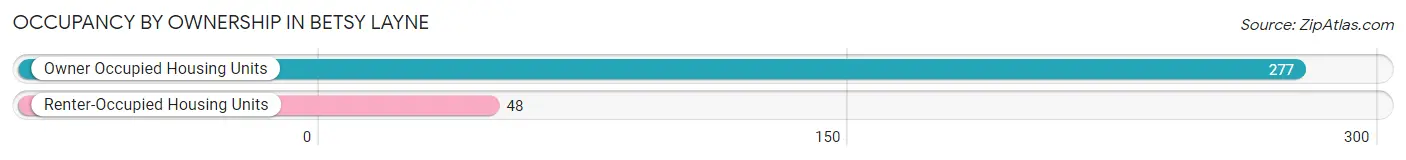
| Occupancy | # Housing Units | % Housing Units |
| Owner Occupied Housing Units | 277 | 85.2% |
| Renter-Occupied Housing Units | 48 | 14.8% |
| Total Occupied Housing Units | 325 | 100.0% |
Occupancy by Household Size in Betsy Layne
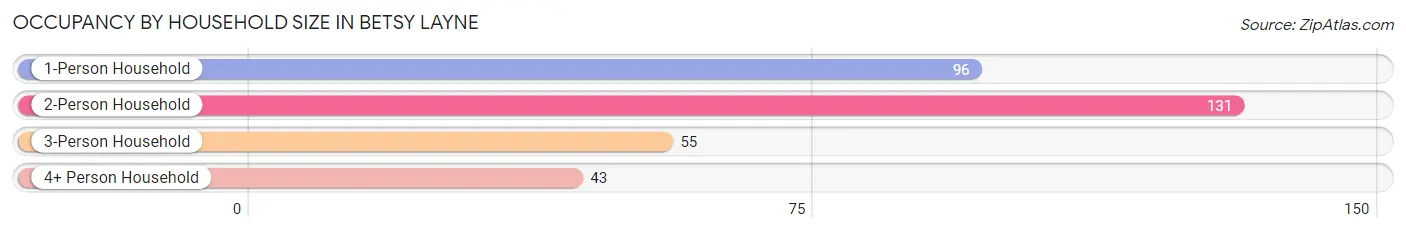
| Household Size | # Housing Units | % Housing Units |
| 1-Person Household | 96 | 29.5% |
| 2-Person Household | 131 | 40.3% |
| 3-Person Household | 55 | 16.9% |
| 4+ Person Household | 43 | 13.2% |
| Total Housing Units | 325 | 100.0% |
Occupancy by Ownership by Household Size in Betsy Layne
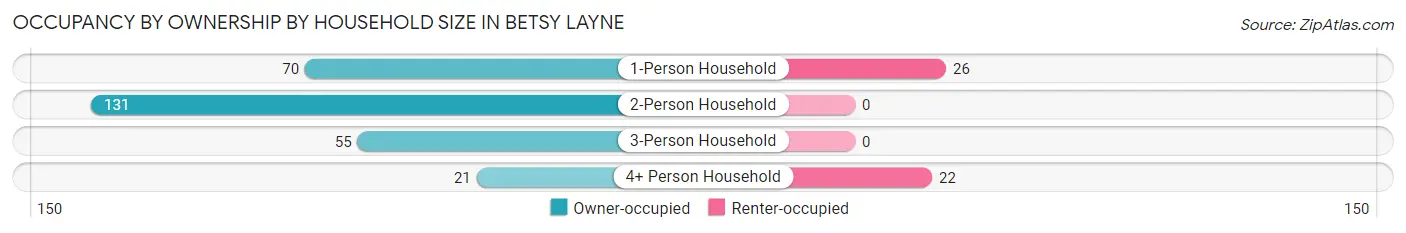
| Household Size | Owner-occupied | Renter-occupied |
| 1-Person Household | 70 (72.9%) | 26 (27.1%) |
| 2-Person Household | 131 (100.0%) | 0 (0.0%) |
| 3-Person Household | 55 (100.0%) | 0 (0.0%) |
| 4+ Person Household | 21 (48.8%) | 22 (51.2%) |
| Total Housing Units | 277 (85.2%) | 48 (14.8%) |
Occupancy by Educational Attainment in Betsy Layne
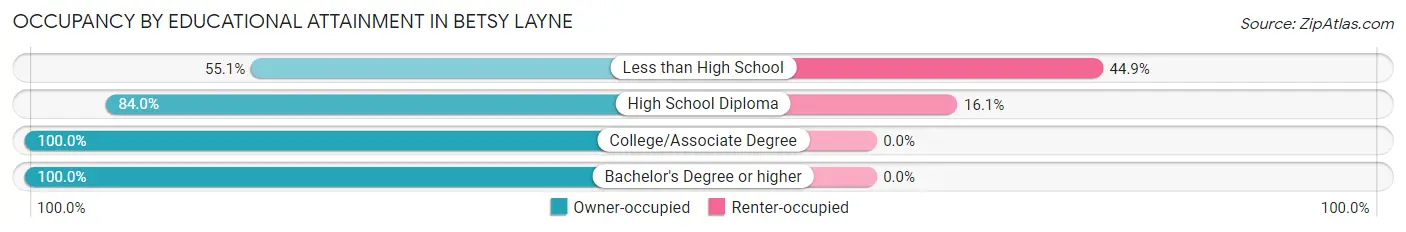
| Household Size | Owner-occupied | Renter-occupied |
| Less than High School | 27 (55.1%) | 22 (44.9%) |
| High School Diploma | 136 (84.0%) | 26 (16.1%) |
| College/Associate Degree | 44 (100.0%) | 0 (0.0%) |
| Bachelor's Degree or higher | 70 (100.0%) | 0 (0.0%) |
Occupancy by Age of Householder in Betsy Layne
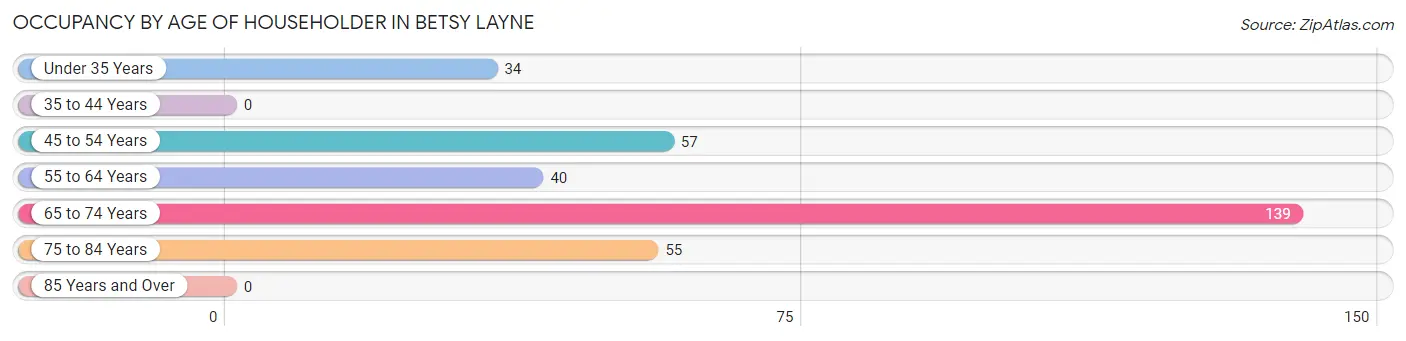
| Age Bracket | # Households | % Households |
| Under 35 Years | 34 | 10.5% |
| 35 to 44 Years | 0 | 0.0% |
| 45 to 54 Years | 57 | 17.5% |
| 55 to 64 Years | 40 | 12.3% |
| 65 to 74 Years | 139 | 42.8% |
| 75 to 84 Years | 55 | 16.9% |
| 85 Years and Over | 0 | 0.0% |
| Total | 325 | 100.0% |
Housing Finances in Betsy Layne
Median Income by Occupancy in Betsy Layne
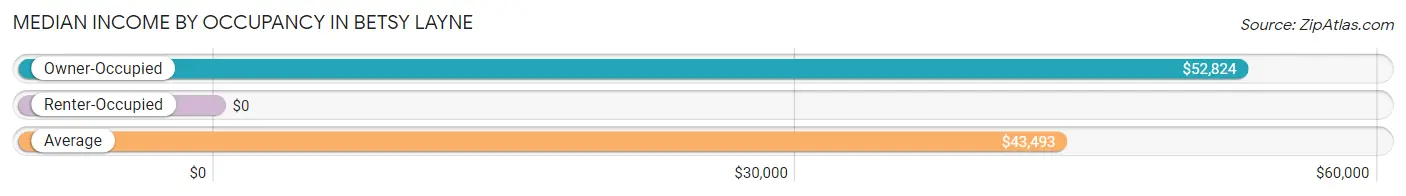
| Occupancy Type | # Households | Median Income |
| Owner-Occupied | 277 (85.2%) | $52,824 |
| Renter-Occupied | 48 (14.8%) | $0 |
| Average | 325 (100.0%) | $43,493 |
Occupancy by Householder Income Bracket in Betsy Layne
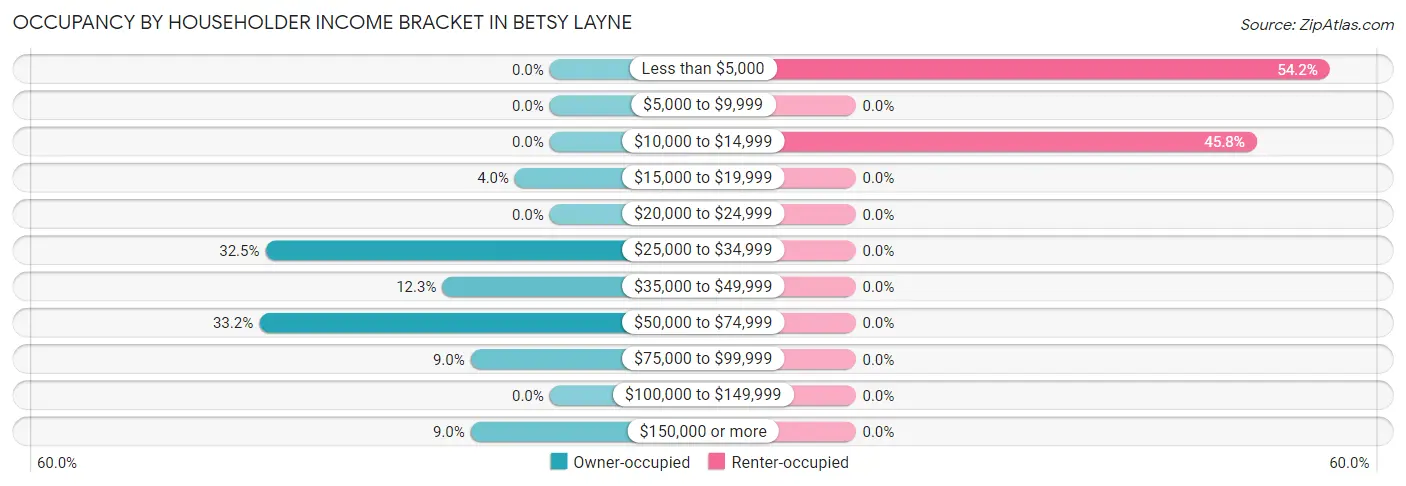
| Income Bracket | Owner-occupied | Renter-occupied |
| Less than $5,000 | 0 (0.0%) | 26 (54.2%) |
| $5,000 to $9,999 | 0 (0.0%) | 0 (0.0%) |
| $10,000 to $14,999 | 0 (0.0%) | 22 (45.8%) |
| $15,000 to $19,999 | 11 (4.0%) | 0 (0.0%) |
| $20,000 to $24,999 | 0 (0.0%) | 0 (0.0%) |
| $25,000 to $34,999 | 90 (32.5%) | 0 (0.0%) |
| $35,000 to $49,999 | 34 (12.3%) | 0 (0.0%) |
| $50,000 to $74,999 | 92 (33.2%) | 0 (0.0%) |
| $75,000 to $99,999 | 25 (9.0%) | 0 (0.0%) |
| $100,000 to $149,999 | 0 (0.0%) | 0 (0.0%) |
| $150,000 or more | 25 (9.0%) | 0 (0.0%) |
| Total | 277 (100.0%) | 48 (100.0%) |
Monthly Housing Cost Tiers in Betsy Layne
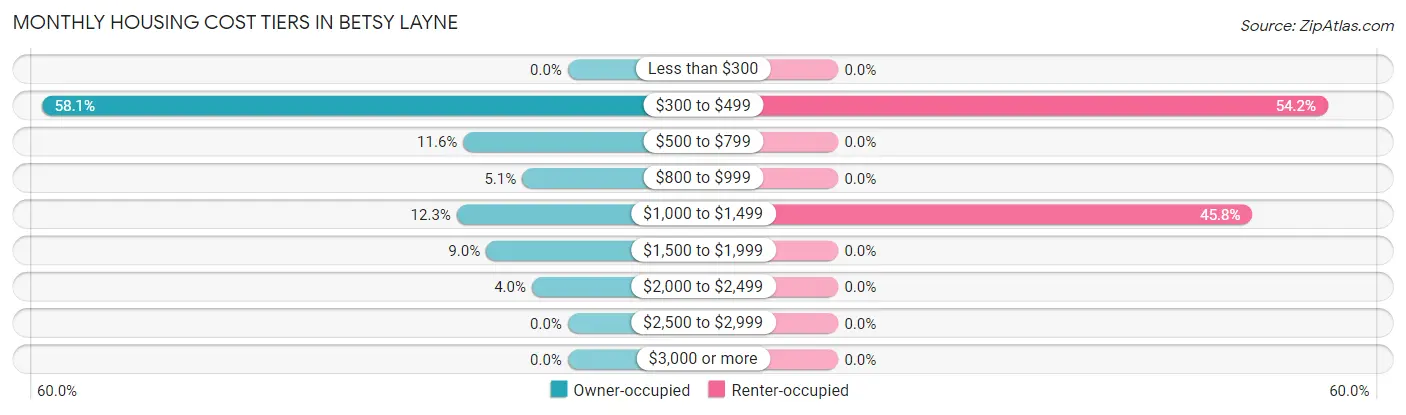
| Monthly Cost | Owner-occupied | Renter-occupied |
| Less than $300 | 0 (0.0%) | 0 (0.0%) |
| $300 to $499 | 161 (58.1%) | 26 (54.2%) |
| $500 to $799 | 32 (11.6%) | 0 (0.0%) |
| $800 to $999 | 14 (5.1%) | 0 (0.0%) |
| $1,000 to $1,499 | 34 (12.3%) | 22 (45.8%) |
| $1,500 to $1,999 | 25 (9.0%) | 0 (0.0%) |
| $2,000 to $2,499 | 11 (4.0%) | 0 (0.0%) |
| $2,500 to $2,999 | 0 (0.0%) | 0 (0.0%) |
| $3,000 or more | 0 (0.0%) | 0 (0.0%) |
| Total | 277 (100.0%) | 48 (100.0%) |
Physical Housing Characteristics in Betsy Layne
Housing Structures in Betsy Layne
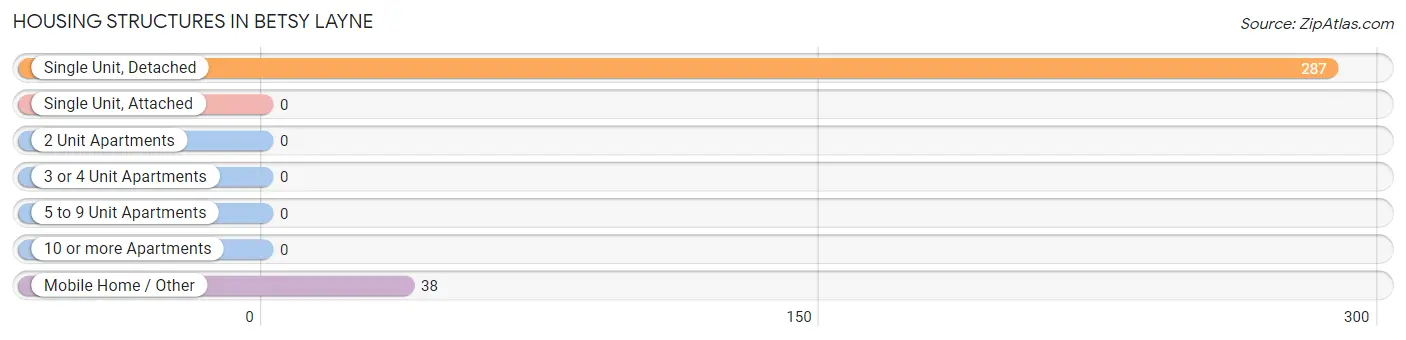
| Structure Type | # Housing Units | % Housing Units |
| Single Unit, Detached | 287 | 88.3% |
| Single Unit, Attached | 0 | 0.0% |
| 2 Unit Apartments | 0 | 0.0% |
| 3 or 4 Unit Apartments | 0 | 0.0% |
| 5 to 9 Unit Apartments | 0 | 0.0% |
| 10 or more Apartments | 0 | 0.0% |
| Mobile Home / Other | 38 | 11.7% |
| Total | 325 | 100.0% |
Housing Structures by Occupancy in Betsy Layne
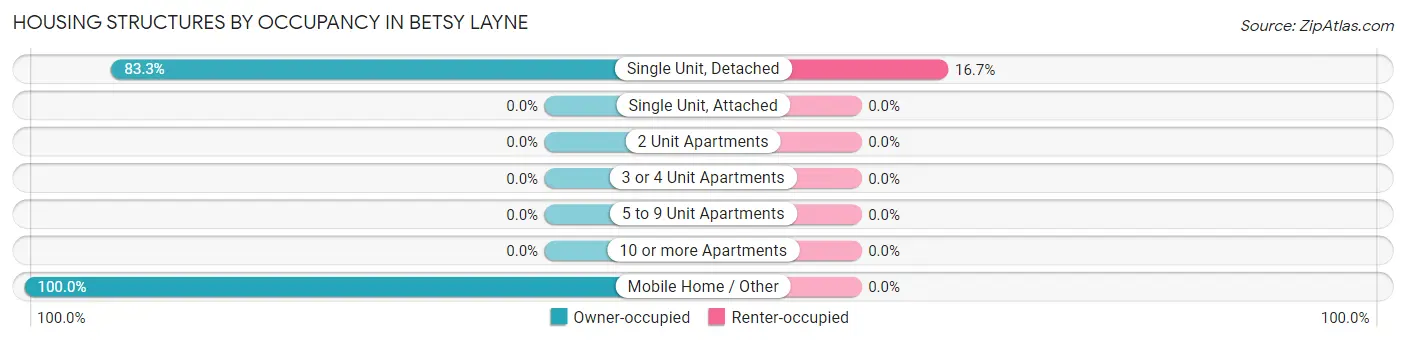
| Structure Type | Owner-occupied | Renter-occupied |
| Single Unit, Detached | 239 (83.3%) | 48 (16.7%) |
| Single Unit, Attached | 0 (0.0%) | 0 (0.0%) |
| 2 Unit Apartments | 0 (0.0%) | 0 (0.0%) |
| 3 or 4 Unit Apartments | 0 (0.0%) | 0 (0.0%) |
| 5 to 9 Unit Apartments | 0 (0.0%) | 0 (0.0%) |
| 10 or more Apartments | 0 (0.0%) | 0 (0.0%) |
| Mobile Home / Other | 38 (100.0%) | 0 (0.0%) |
| Total | 277 (85.2%) | 48 (14.8%) |
Housing Structures by Number of Rooms in Betsy Layne
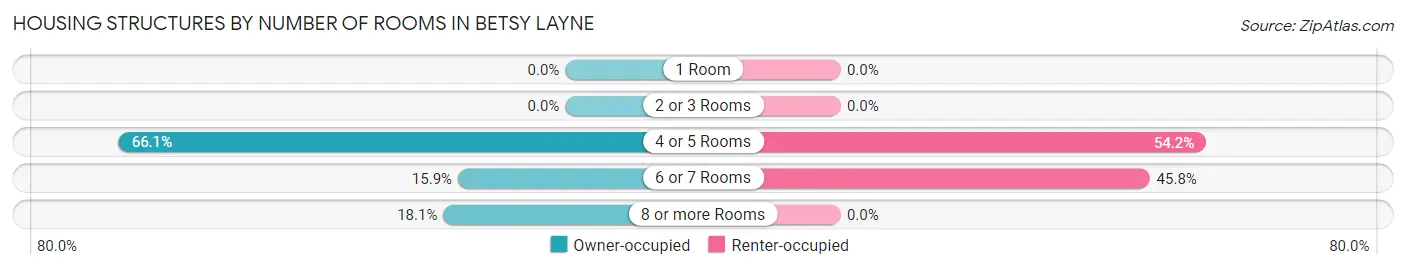
| Number of Rooms | Owner-occupied | Renter-occupied |
| 1 Room | 0 (0.0%) | 0 (0.0%) |
| 2 or 3 Rooms | 0 (0.0%) | 0 (0.0%) |
| 4 or 5 Rooms | 183 (66.1%) | 26 (54.2%) |
| 6 or 7 Rooms | 44 (15.9%) | 22 (45.8%) |
| 8 or more Rooms | 50 (18.0%) | 0 (0.0%) |
| Total | 277 (100.0%) | 48 (100.0%) |
Housing Structure by Heating Type in Betsy Layne
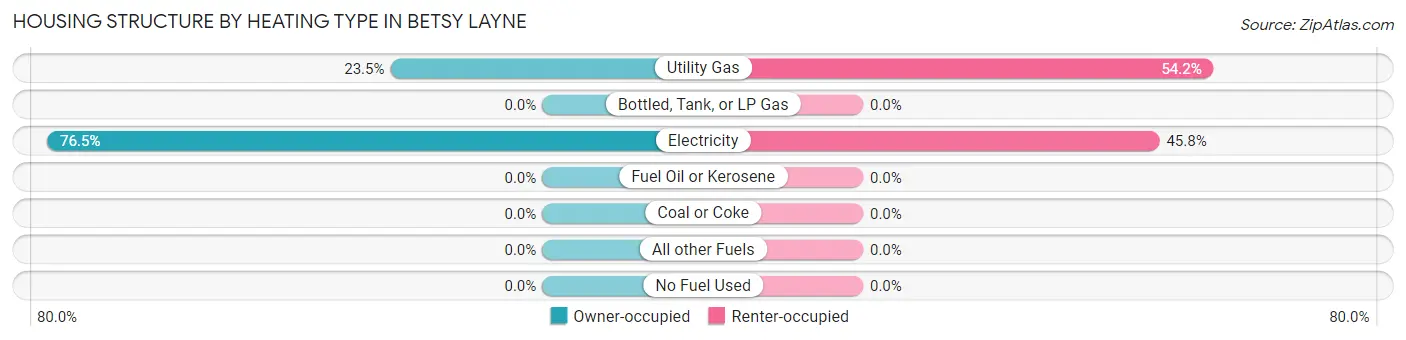
| Heating Type | Owner-occupied | Renter-occupied |
| Utility Gas | 65 (23.5%) | 26 (54.2%) |
| Bottled, Tank, or LP Gas | 0 (0.0%) | 0 (0.0%) |
| Electricity | 212 (76.5%) | 22 (45.8%) |
| Fuel Oil or Kerosene | 0 (0.0%) | 0 (0.0%) |
| Coal or Coke | 0 (0.0%) | 0 (0.0%) |
| All other Fuels | 0 (0.0%) | 0 (0.0%) |
| No Fuel Used | 0 (0.0%) | 0 (0.0%) |
| Total | 277 (100.0%) | 48 (100.0%) |
Household Vehicle Usage in Betsy Layne
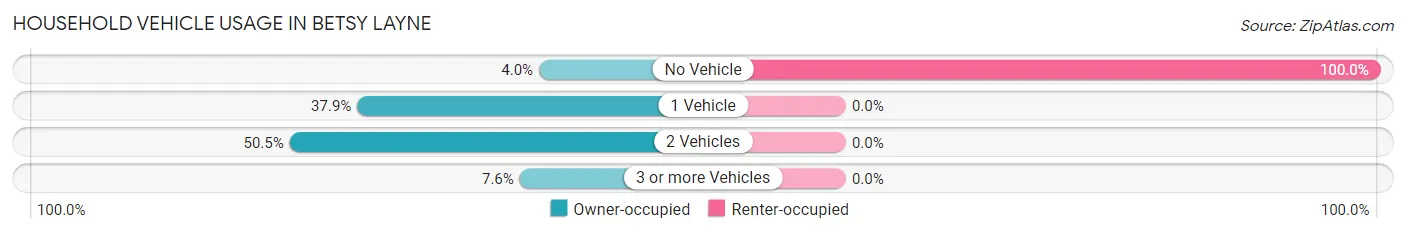
| Vehicles per Household | Owner-occupied | Renter-occupied |
| No Vehicle | 11 (4.0%) | 48 (100.0%) |
| 1 Vehicle | 105 (37.9%) | 0 (0.0%) |
| 2 Vehicles | 140 (50.5%) | 0 (0.0%) |
| 3 or more Vehicles | 21 (7.6%) | 0 (0.0%) |
| Total | 277 (100.0%) | 48 (100.0%) |
Real Estate & Mortgages in Betsy Layne
Real Estate and Mortgage Overview in Betsy Layne
| Characteristic | Without Mortgage | With Mortgage |
| Housing Units | 186 | 91 |
| Median Property Value | $59,200 | $0 |
| Median Household Income | - | - |
| Monthly Housing Costs | $377 | $0 |
| Real Estate Taxes | $273 | $0 |
Property Value by Mortgage Status in Betsy Layne
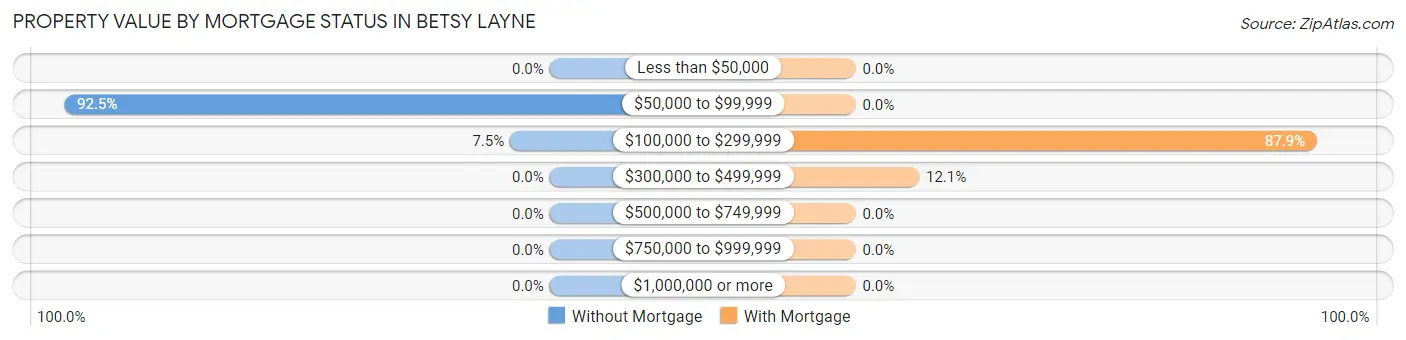
| Property Value | Without Mortgage | With Mortgage |
| Less than $50,000 | 0 (0.0%) | 0 (0.0%) |
| $50,000 to $99,999 | 172 (92.5%) | 0 (0.0%) |
| $100,000 to $299,999 | 14 (7.5%) | 80 (87.9%) |
| $300,000 to $499,999 | 0 (0.0%) | 11 (12.1%) |
| $500,000 to $749,999 | 0 (0.0%) | 0 (0.0%) |
| $750,000 to $999,999 | 0 (0.0%) | 0 (0.0%) |
| $1,000,000 or more | 0 (0.0%) | 0 (0.0%) |
| Total | 186 (100.0%) | 91 (100.0%) |
Household Income by Mortgage Status in Betsy Layne
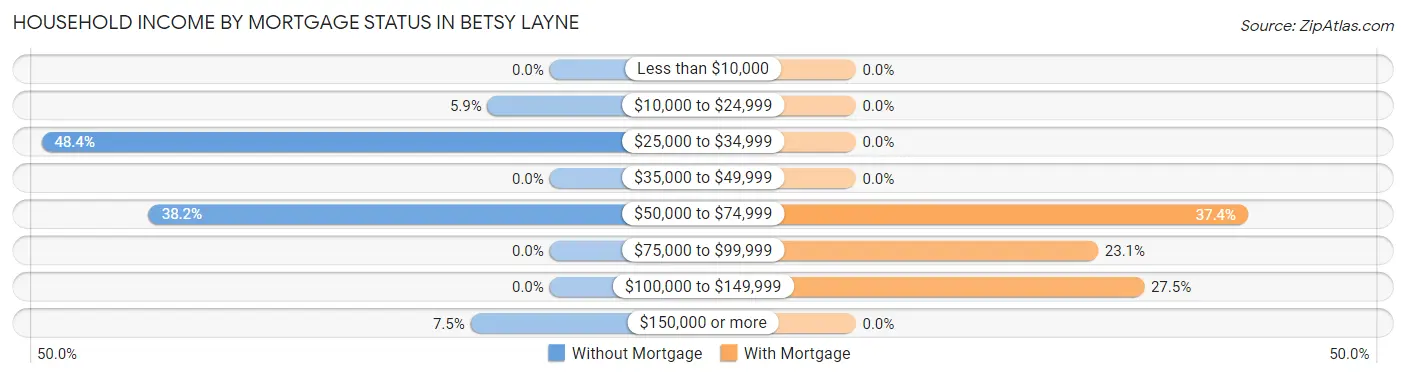
| Household Income | Without Mortgage | With Mortgage |
| Less than $10,000 | 0 (0.0%) | 0 (0.0%) |
| $10,000 to $24,999 | 11 (5.9%) | 0 (0.0%) |
| $25,000 to $34,999 | 90 (48.4%) | 0 (0.0%) |
| $35,000 to $49,999 | 0 (0.0%) | 0 (0.0%) |
| $50,000 to $74,999 | 71 (38.2%) | 34 (37.4%) |
| $75,000 to $99,999 | 0 (0.0%) | 21 (23.1%) |
| $100,000 to $149,999 | 0 (0.0%) | 25 (27.5%) |
| $150,000 or more | 14 (7.5%) | 0 (0.0%) |
| Total | 186 (100.0%) | 91 (100.0%) |
Property Value to Household Income Ratio in Betsy Layne
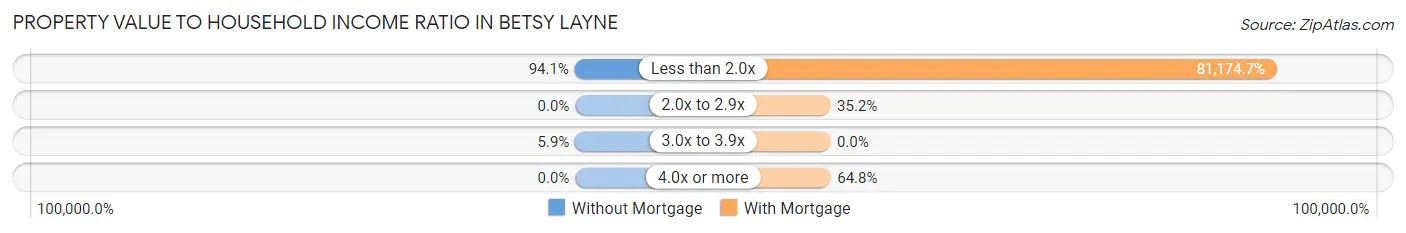
| Value-to-Income Ratio | Without Mortgage | With Mortgage |
| Less than 2.0x | 175 (94.1%) | 73,869 (81,174.7%) |
| 2.0x to 2.9x | 0 (0.0%) | 32 (35.2%) |
| 3.0x to 3.9x | 11 (5.9%) | 0 (0.0%) |
| 4.0x or more | 0 (0.0%) | 59 (64.8%) |
| Total | 186 (100.0%) | 91 (100.0%) |
Real Estate Taxes by Mortgage Status in Betsy Layne
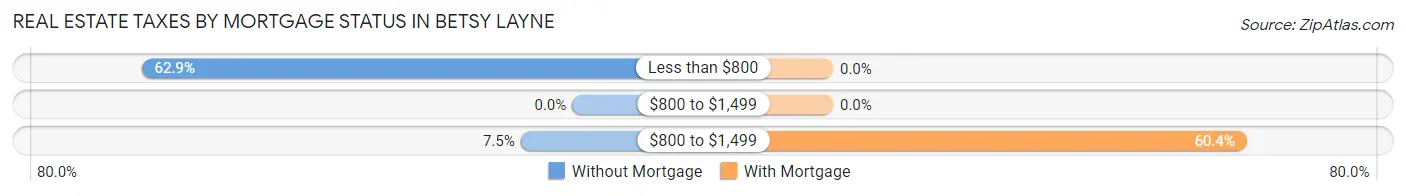
| Property Taxes | Without Mortgage | With Mortgage |
| Less than $800 | 117 (62.9%) | 0 (0.0%) |
| $800 to $1,499 | 0 (0.0%) | 0 (0.0%) |
| $800 to $1,499 | 14 (7.5%) | 55 (60.4%) |
| Total | 186 (100.0%) | 91 (100.0%) |
Health & Disability in Betsy Layne
Health Insurance Coverage by Age in Betsy Layne
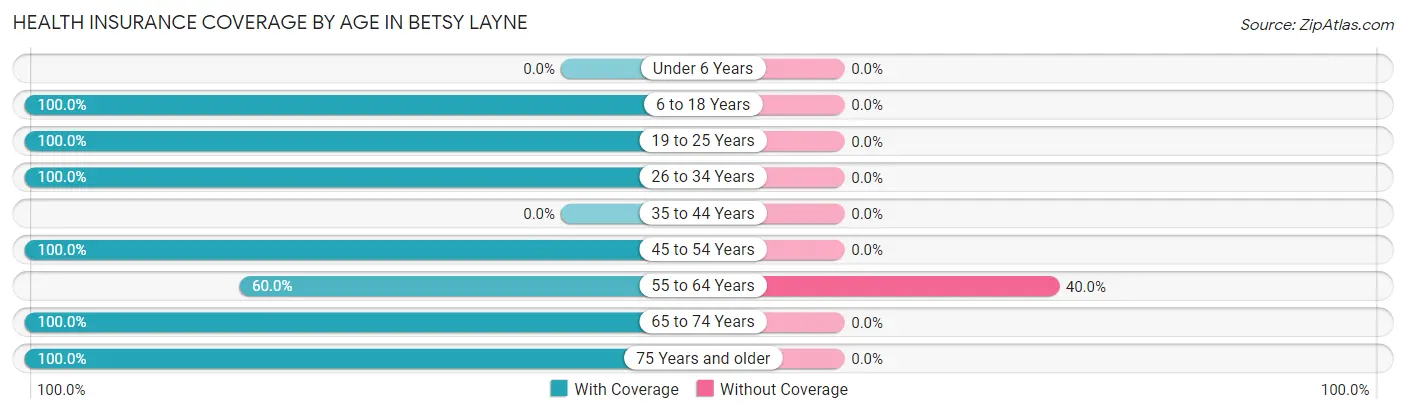
| Age Bracket | With Coverage | Without Coverage |
| Under 6 Years | 0 (0.0%) | 0 (0.0%) |
| 6 to 18 Years | 104 (100.0%) | 0 (0.0%) |
| 19 to 25 Years | 26 (100.0%) | 0 (0.0%) |
| 26 to 34 Years | 34 (100.0%) | 0 (0.0%) |
| 35 to 44 Years | 0 (0.0%) | 0 (0.0%) |
| 45 to 54 Years | 131 (100.0%) | 0 (0.0%) |
| 55 to 64 Years | 39 (60.0%) | 26 (40.0%) |
| 65 to 74 Years | 233 (100.0%) | 0 (0.0%) |
| 75 Years and older | 69 (100.0%) | 0 (0.0%) |
| Total | 636 (96.1%) | 26 (3.9%) |
Health Insurance Coverage by Citizenship Status in Betsy Layne
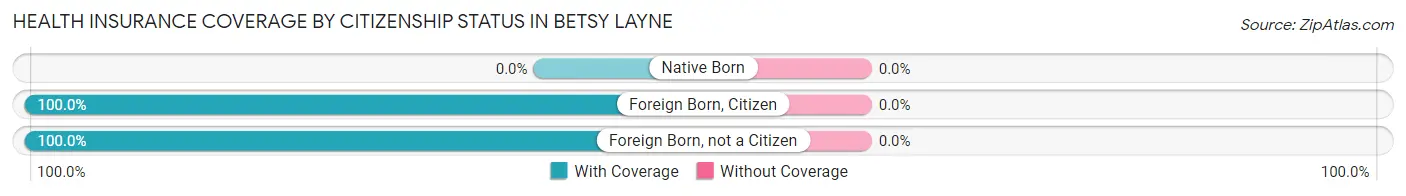
| Citizenship Status | With Coverage | Without Coverage |
| Native Born | 0 (0.0%) | 0 (0.0%) |
| Foreign Born, Citizen | 104 (100.0%) | 0 (0.0%) |
| Foreign Born, not a Citizen | 26 (100.0%) | 0 (0.0%) |
Health Insurance Coverage by Household Income in Betsy Layne
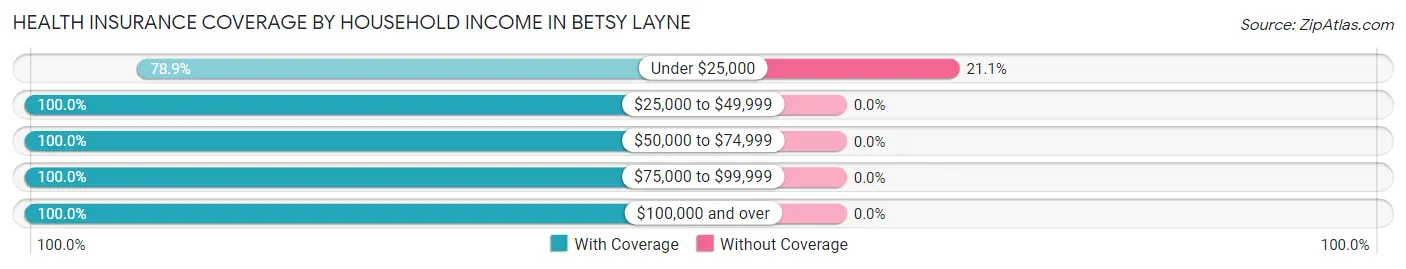
| Household Income | With Coverage | Without Coverage |
| Under $25,000 | 97 (78.9%) | 26 (21.1%) |
| $25,000 to $49,999 | 191 (100.0%) | 0 (0.0%) |
| $50,000 to $74,999 | 254 (100.0%) | 0 (0.0%) |
| $75,000 to $99,999 | 25 (100.0%) | 0 (0.0%) |
| $100,000 and over | 69 (100.0%) | 0 (0.0%) |
Public vs Private Health Insurance Coverage by Age in Betsy Layne
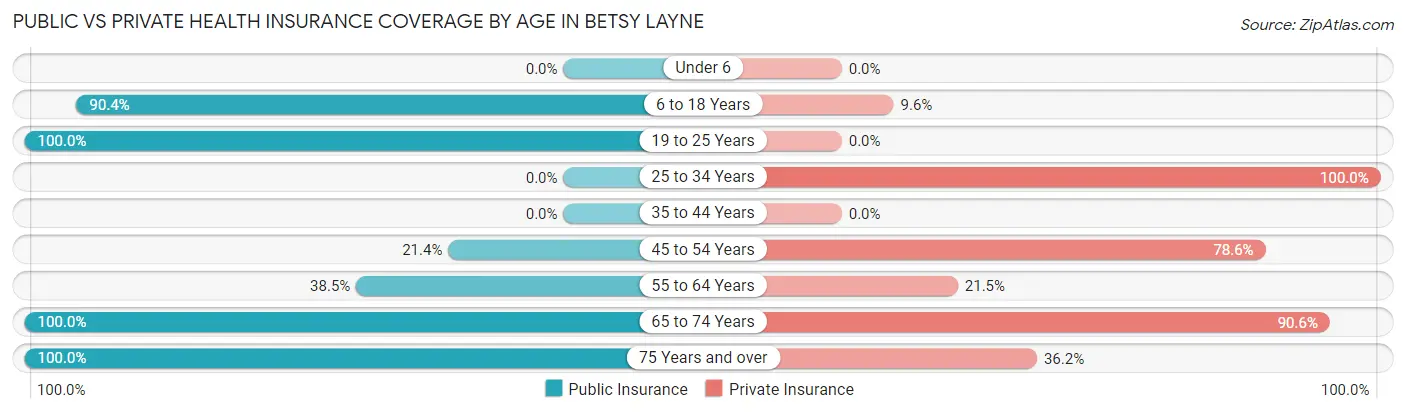
| Age Bracket | Public Insurance | Private Insurance |
| Under 6 | 0 (0.0%) | 0 (0.0%) |
| 6 to 18 Years | 94 (90.4%) | 10 (9.6%) |
| 19 to 25 Years | 26 (100.0%) | 0 (0.0%) |
| 25 to 34 Years | 0 (0.0%) | 34 (100.0%) |
| 35 to 44 Years | 0 (0.0%) | 0 (0.0%) |
| 45 to 54 Years | 28 (21.4%) | 103 (78.6%) |
| 55 to 64 Years | 25 (38.5%) | 14 (21.5%) |
| 65 to 74 Years | 233 (100.0%) | 211 (90.6%) |
| 75 Years and over | 69 (100.0%) | 25 (36.2%) |
| Total | 475 (71.8%) | 397 (60.0%) |
Disability Status by Sex by Age in Betsy Layne
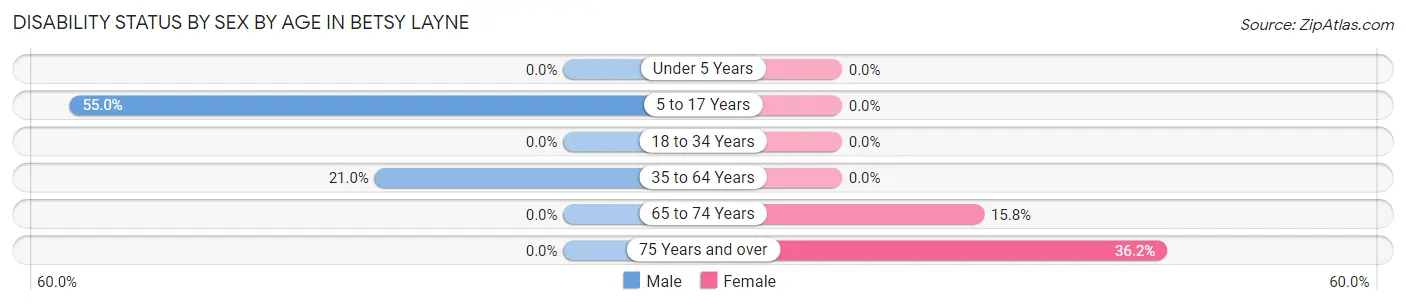
| Age Bracket | Male | Female |
| Under 5 Years | 0 (0.0%) | 0 (0.0%) |
| 5 to 17 Years | 22 (55.0%) | 0 (0.0%) |
| 18 to 34 Years | 0 (0.0%) | 0 (0.0%) |
| 35 to 64 Years | 25 (21.0%) | 0 (0.0%) |
| 65 to 74 Years | 0 (0.0%) | 22 (15.8%) |
| 75 Years and over | 0 (0.0%) | 25 (36.2%) |
Disability Class by Sex by Age in Betsy Layne
Disability Class: Hearing Difficulty
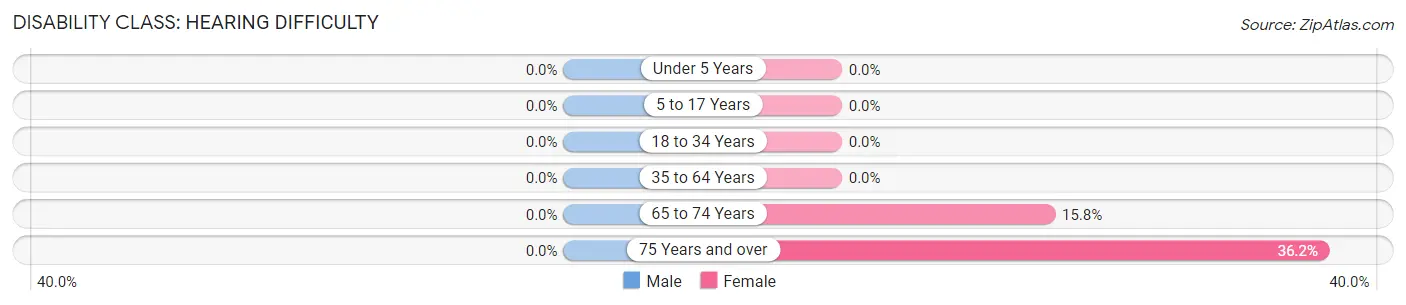
| Age Bracket | Male | Female |
| Under 5 Years | 0 (0.0%) | 0 (0.0%) |
| 5 to 17 Years | 0 (0.0%) | 0 (0.0%) |
| 18 to 34 Years | 0 (0.0%) | 0 (0.0%) |
| 35 to 64 Years | 0 (0.0%) | 0 (0.0%) |
| 65 to 74 Years | 0 (0.0%) | 22 (15.8%) |
| 75 Years and over | 0 (0.0%) | 25 (36.2%) |
Disability Class: Vision Difficulty
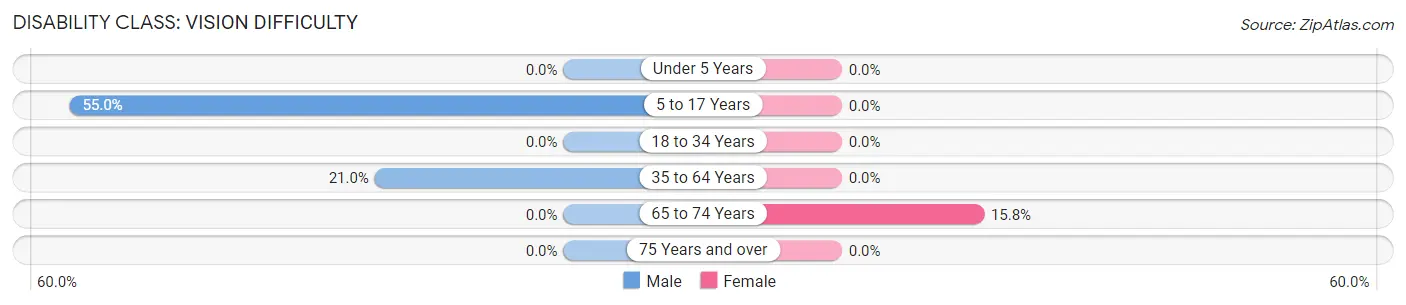
| Age Bracket | Male | Female |
| Under 5 Years | 0 (0.0%) | 0 (0.0%) |
| 5 to 17 Years | 22 (55.0%) | 0 (0.0%) |
| 18 to 34 Years | 0 (0.0%) | 0 (0.0%) |
| 35 to 64 Years | 25 (21.0%) | 0 (0.0%) |
| 65 to 74 Years | 0 (0.0%) | 22 (15.8%) |
| 75 Years and over | 0 (0.0%) | 0 (0.0%) |
Disability Class: Cognitive Difficulty
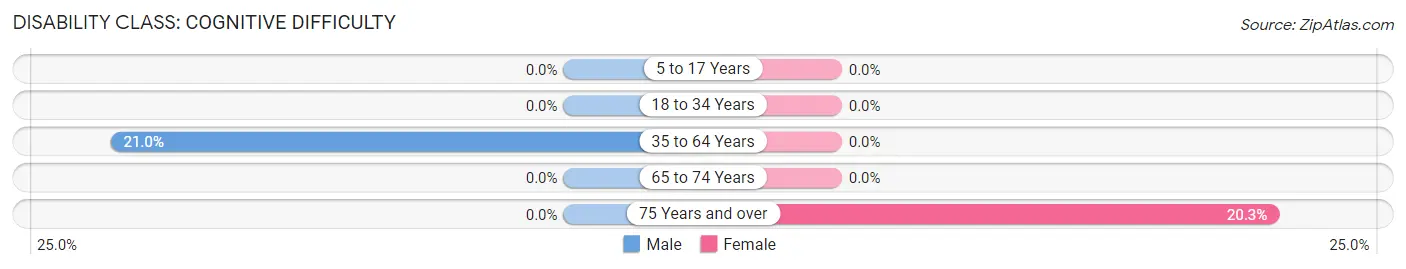
| Age Bracket | Male | Female |
| 5 to 17 Years | 0 (0.0%) | 0 (0.0%) |
| 18 to 34 Years | 0 (0.0%) | 0 (0.0%) |
| 35 to 64 Years | 25 (21.0%) | 0 (0.0%) |
| 65 to 74 Years | 0 (0.0%) | 0 (0.0%) |
| 75 Years and over | 0 (0.0%) | 14 (20.3%) |
Disability Class: Ambulatory Difficulty
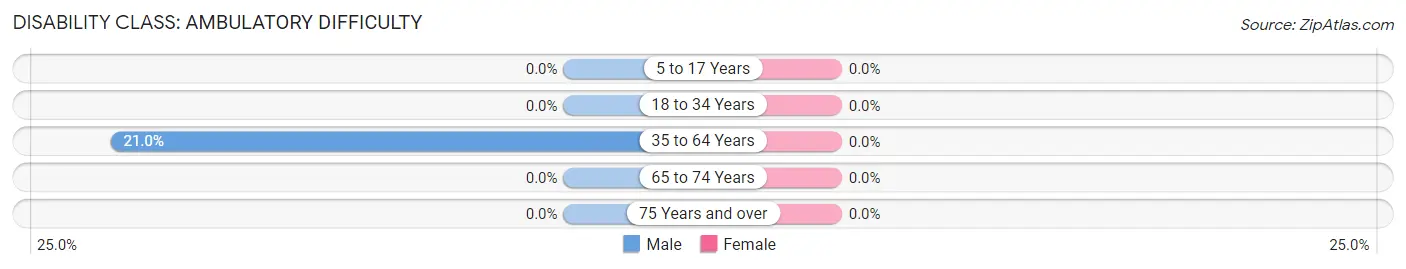
| Age Bracket | Male | Female |
| 5 to 17 Years | 0 (0.0%) | 0 (0.0%) |
| 18 to 34 Years | 0 (0.0%) | 0 (0.0%) |
| 35 to 64 Years | 25 (21.0%) | 0 (0.0%) |
| 65 to 74 Years | 0 (0.0%) | 0 (0.0%) |
| 75 Years and over | 0 (0.0%) | 0 (0.0%) |
Disability Class: Self-Care Difficulty
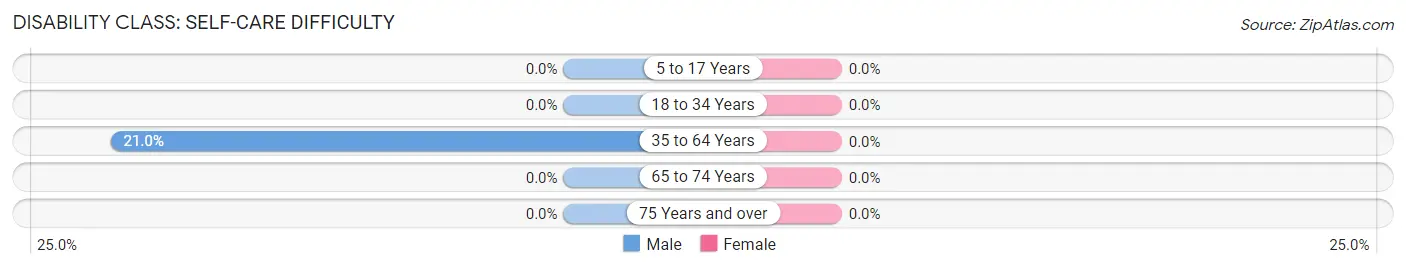
| Age Bracket | Male | Female |
| 5 to 17 Years | 0 (0.0%) | 0 (0.0%) |
| 18 to 34 Years | 0 (0.0%) | 0 (0.0%) |
| 35 to 64 Years | 25 (21.0%) | 0 (0.0%) |
| 65 to 74 Years | 0 (0.0%) | 0 (0.0%) |
| 75 Years and over | 0 (0.0%) | 0 (0.0%) |
Technology Access in Betsy Layne
Computing Device Access in Betsy Layne
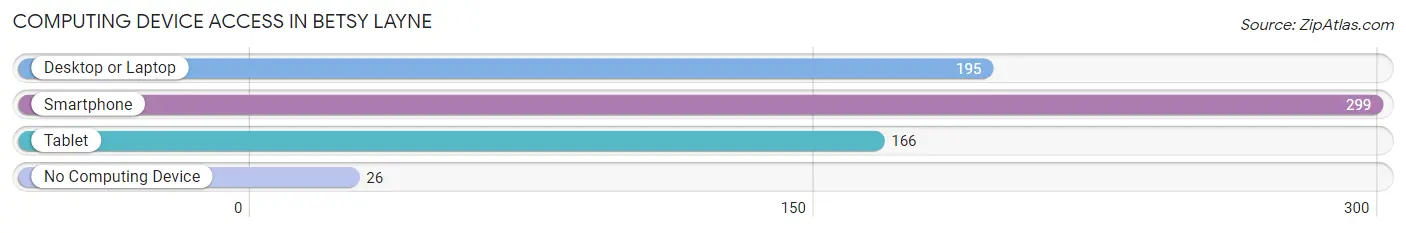
| Device Type | # Households | % Households |
| Desktop or Laptop | 195 | 60.0% |
| Smartphone | 299 | 92.0% |
| Tablet | 166 | 51.1% |
| No Computing Device | 26 | 8.0% |
| Total | 325 | 100.0% |
Internet Access in Betsy Layne
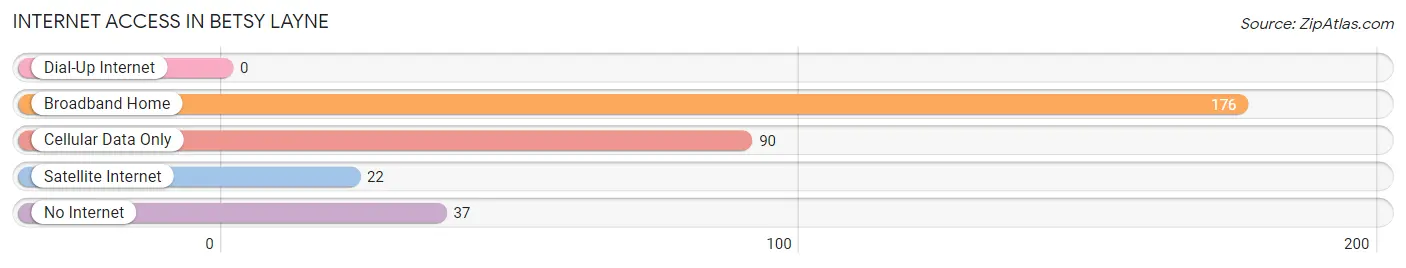
| Internet Type | # Households | % Households |
| Dial-Up Internet | 0 | 0.0% |
| Broadband Home | 176 | 54.1% |
| Cellular Data Only | 90 | 27.7% |
| Satellite Internet | 22 | 6.8% |
| No Internet | 37 | 11.4% |
| Total | 325 | 100.0% |
Betsy Layne Summary
Betsy Layne is a small unincorporated community located in Floyd County, Kentucky. It is situated in the foothills of the Appalachian Mountains, and is part of the Big Sandy region. The town was named after Betsy Layne, the daughter of a local settler.
History
The area that is now Betsy Layne was first settled in the late 1700s by a group of settlers from Virginia. The town was officially established in 1820, and was named after Betsy Layne, the daughter of one of the settlers. The town was originally a farming community, and the main crops grown were corn, tobacco, and hay.
In the late 1800s, the town began to grow and develop. The first post office was established in 1883, and the first school was built in 1885. The town also had a general store, a blacksmith shop, and a gristmill.
In the early 1900s, the town began to decline. The railroad bypassed the town, and many of the businesses closed. The population of the town decreased, and by the 1950s, the town had become a virtual ghost town.
In the late 1970s, the town began to experience a revival. The population began to increase, and new businesses began to open. Today, Betsy Layne is a small, rural community with a population of around 500 people.
Geography
Betsy Layne is located in the foothills of the Appalachian Mountains in Floyd County, Kentucky. The town is situated along the banks of the Big Sandy River, and is surrounded by rolling hills and forests. The climate in the area is humid subtropical, with hot summers and mild winters.
Economy
The economy of Betsy Layne is largely based on agriculture. The main crops grown in the area are corn, tobacco, and hay. The town also has a few small businesses, including a general store, a gas station, and a few restaurants.
Demographics
As of the 2010 census, the population of Betsy Layne was 498. The racial makeup of the town was 97.2% White, 0.6% African American, 0.2% Native American, 0.2% Asian, and 1.8% from other races. The median household income was $25,000, and the median age was 41.5 years.
Common Questions
What is Per Capita Income in Betsy Layne?
Per Capita income in Betsy Layne is $25,575.
What is the Median Household income in Betsy Layne?
Median Household Income in Betsy Layne is $43,493.
What is Inequality or Gini Index in Betsy Layne?
Inequality or Gini Index in Betsy Layne is 0.40.
What is the Total Population of Betsy Layne?
Total Population of Betsy Layne is 662.
What is the Total Male Population of Betsy Layne?
Total Male Population of Betsy Layne is 287.
What is the Total Female Population of Betsy Layne?
Total Female Population of Betsy Layne is 375.
What is the Ratio of Males per 100 Females in Betsy Layne?
There are 76.53 Males per 100 Females in Betsy Layne.
What is the Ratio of Females per 100 Males in Betsy Layne?
There are 130.66 Females per 100 Males in Betsy Layne.
What is the Median Population Age in Betsy Layne?
Median Population Age in Betsy Layne is 57.7 Years.
What is the Average Family Size in Betsy Layne
Average Family Size in Betsy Layne is 2.5 People.
What is the Average Household Size in Betsy Layne
Average Household Size in Betsy Layne is 2.0 People.
How Large is the Labor Force in Betsy Layne?
There are 225 People in the Labor Forcein in Betsy Layne.
What is the Percentage of People in the Labor Force in Betsy Layne?
38.8% of People are in the Labor Force in Betsy Layne.
What is the Unemployment Rate in Betsy Layne?
Unemployment Rate in Betsy Layne is 9.8%.