Zip Codes with the Highest Percentage of Population Employed in Arts, Entertainment & Recreation in Topeka, KS
RELATED REPORTS & OPTIONS
Arts, Entertainment & Recreation
Topeka
Compare Zip Codes
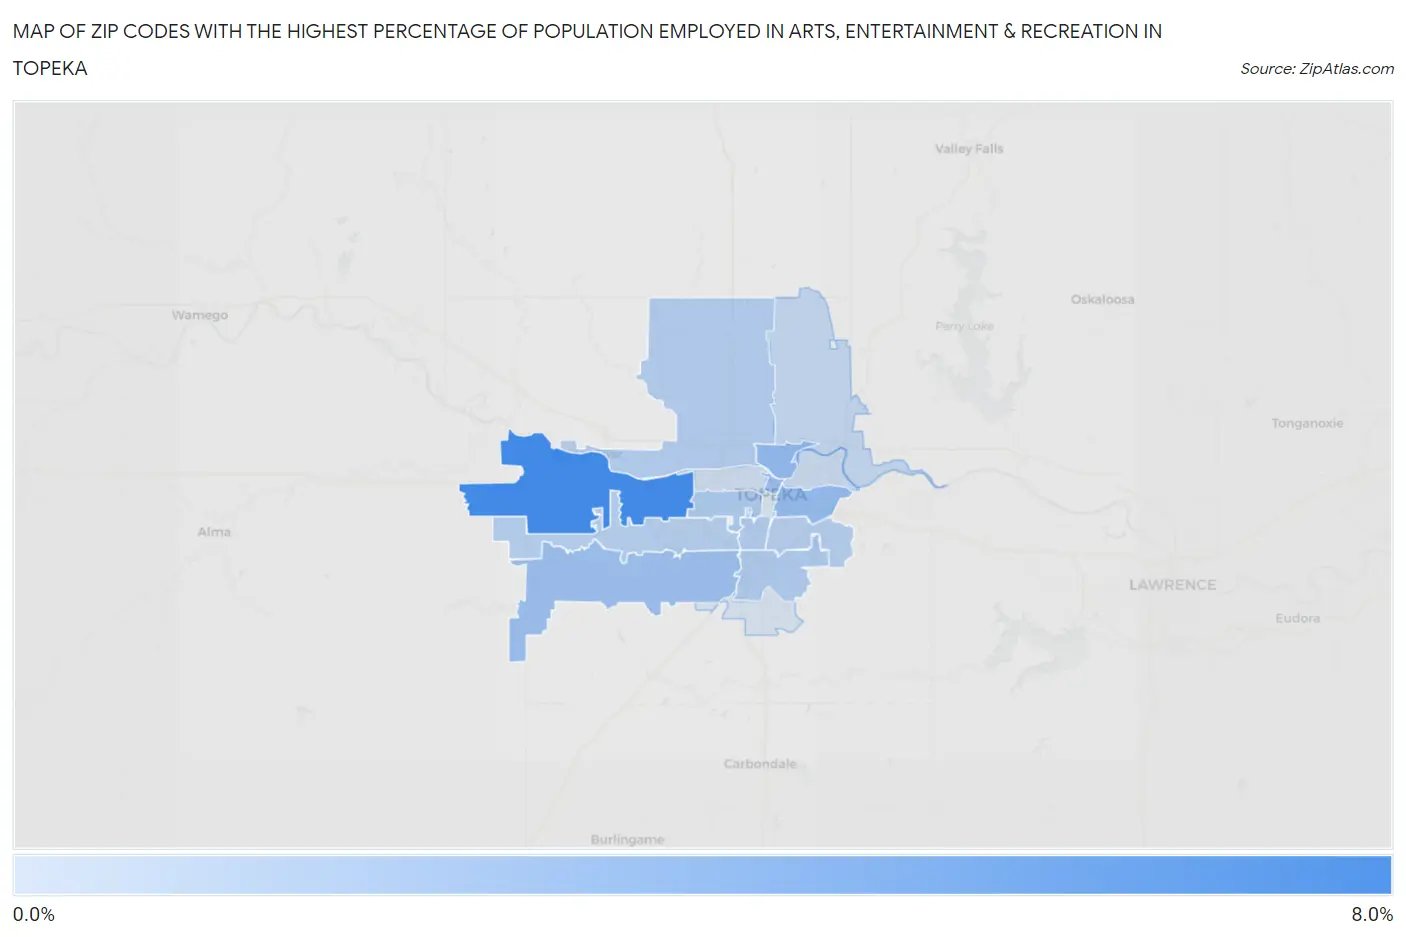
Map of Zip Codes with the Highest Percentage of Population Employed in Arts, Entertainment & Recreation in Topeka
0.0%
8.0%
Zip Codes with the Highest Percentage of Population Employed in Arts, Entertainment & Recreation in Topeka, KS
| Zip Code | % Employed | vs State | vs National | |
| 1. | 66615 | 7.7% | 1.7%(+5.93)#13 | 2.1%(+5.59)#1,140 |
| 2. | 66608 | 3.4% | 1.7%(+1.65)#51 | 2.1%(+1.32)#4,352 |
| 3. | 66607 | 3.2% | 1.7%(+1.41)#57 | 2.1%(+1.07)#4,911 |
| 4. | 66603 | 2.8% | 1.7%(+1.09)#71 | 2.1%(+0.757)#5,857 |
| 5. | 66610 | 2.8% | 1.7%(+1.06)#73 | 2.1%(+0.721)#5,984 |
| 6. | 66604 | 1.9% | 1.7%(+0.184)#144 | 2.1%(-0.151)#10,186 |
| 7. | 66609 | 1.9% | 1.7%(+0.110)#161 | 2.1%(-0.226)#10,652 |
| 8. | 66611 | 1.7% | 1.7%(-0.035)#183 | 2.1%(-0.371)#11,658 |
| 9. | 66618 | 1.6% | 1.7%(-0.112)#196 | 2.1%(-0.448)#12,192 |
| 10. | 66614 | 1.5% | 1.7%(-0.270)#216 | 2.1%(-0.605)#13,396 |
| 11. | 66605 | 1.5% | 1.7%(-0.284)#218 | 2.1%(-0.620)#13,502 |
| 12. | 66617 | 0.88% | 1.7%(-0.866)#307 | 2.1%(-1.20)#17,841 |
| 13. | 66616 | 0.51% | 1.7%(-1.23)#353 | 2.1%(-1.57)#20,415 |
| 14. | 66606 | 0.30% | 1.7%(-1.45)#395 | 2.1%(-1.79)#21,744 |
1
Common Questions
What are the Top 10 Zip Codes with the Highest Percentage of Population Employed in Arts, Entertainment & Recreation in Topeka, KS?
Top 10 Zip Codes with the Highest Percentage of Population Employed in Arts, Entertainment & Recreation in Topeka, KS are:
What zip code has the Highest Percentage of Population Employed in Arts, Entertainment & Recreation in Topeka, KS?
66615 has the Highest Percentage of Population Employed in Arts, Entertainment & Recreation in Topeka, KS with 7.7%.
What is the Percentage of Population Employed in Arts, Entertainment & Recreation in Topeka, KS?
Percentage of Population Employed in Arts, Entertainment & Recreation in Topeka is 1.9%.
What is the Percentage of Population Employed in Arts, Entertainment & Recreation in Kansas?
Percentage of Population Employed in Arts, Entertainment & Recreation in Kansas is 1.7%.
What is the Percentage of Population Employed in Arts, Entertainment & Recreation in the United States?
Percentage of Population Employed in Arts, Entertainment & Recreation in the United States is 2.1%.