Yup'ik vs Immigrants from Cuba Median Family Income
COMPARE
Yup'ik
Immigrants from Cuba
Median Family Income
Median Family Income Comparison
Yup'ik
Immigrants from Cuba
$79,290
MEDIAN FAMILY INCOME
0.0/ 100
METRIC RATING
335th/ 347
METRIC RANK
$78,249
MEDIAN FAMILY INCOME
0.0/ 100
METRIC RATING
336th/ 347
METRIC RANK
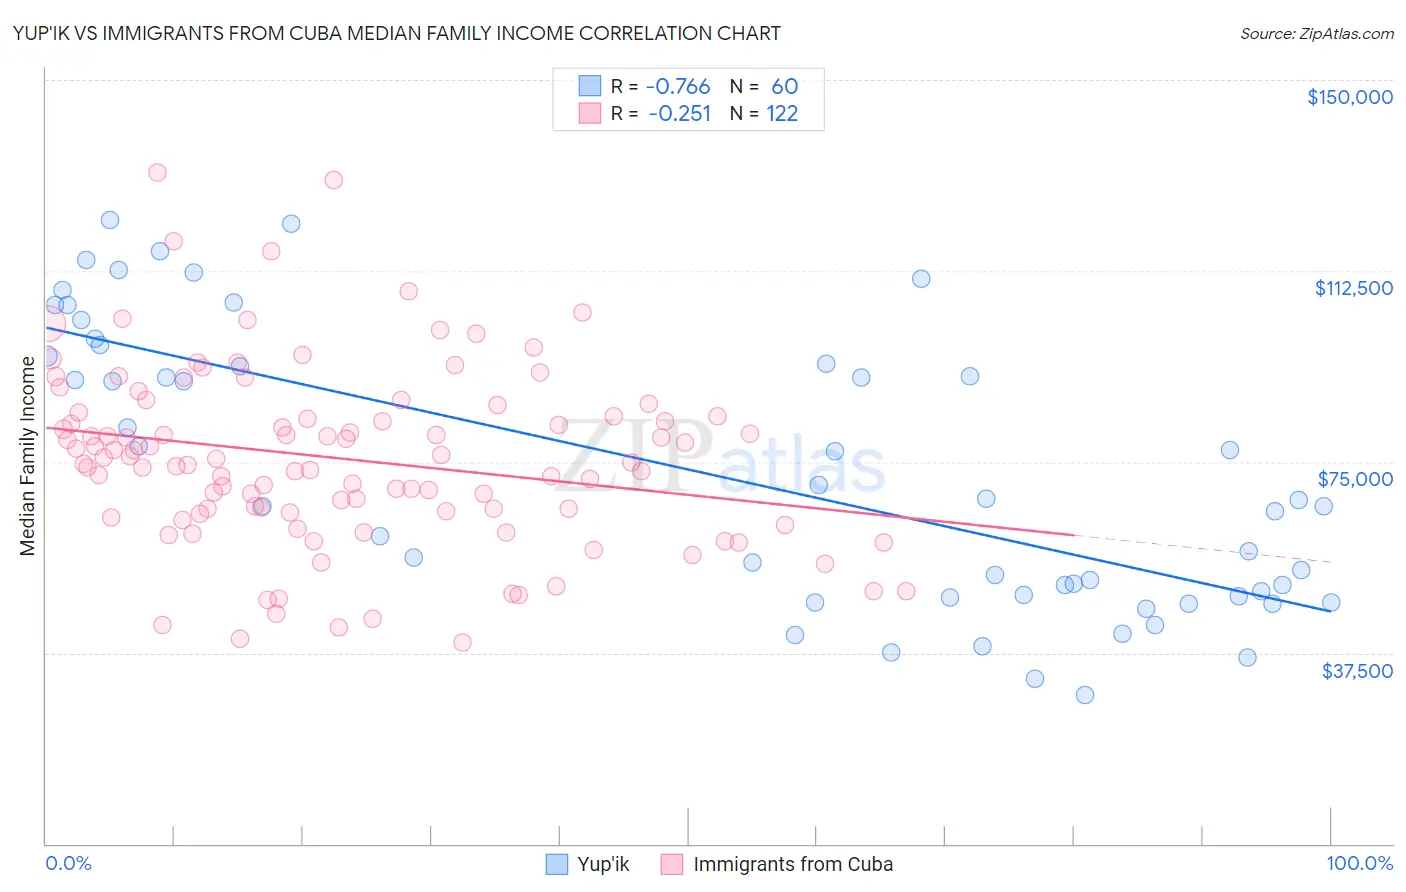
Yup'ik vs Immigrants from Cuba Median Family Income Correlation Chart
The statistical analysis conducted on geographies consisting of 39,952,310 people shows a strong negative correlation between the proportion of Yup'ik and median family income in the United States with a correlation coefficient (R) of -0.766 and weighted average of $79,290. Similarly, the statistical analysis conducted on geographies consisting of 325,826,414 people shows a weak negative correlation between the proportion of Immigrants from Cuba and median family income in the United States with a correlation coefficient (R) of -0.251 and weighted average of $78,249, a difference of 1.3%.
Median Family Income Correlation Summary
| Measurement | Yup'ik | Immigrants from Cuba |
| Minimum | $29,250 | $39,559 |
| Maximum | $122,399 | $131,935 |
| Range | $93,149 | $92,376 |
| Mean | $72,637 | $75,634 |
| Median | $66,875 | $75,235 |
| Interquartile 25% (IQ1) | $48,824 | $64,988 |
| Interquartile 75% (IQ3) | $95,045 | $83,903 |
| Interquartile Range (IQR) | $46,221 | $18,915 |
| Standard Deviation (Sample) | $27,024 | $17,632 |
| Standard Deviation (Population) | $26,798 | $17,559 |
Demographics Similar to Yup'ik and Immigrants from Cuba by Median Family Income
In terms of median family income, the demographic groups most similar to Yup'ik are Menominee ($79,563, a difference of 0.34%), Yuman ($78,055, a difference of 1.6%), Kiowa ($80,885, a difference of 2.0%), Native/Alaskan ($80,908, a difference of 2.0%), and Immigrants from Yemen ($77,457, a difference of 2.4%). Similarly, the demographic groups most similar to Immigrants from Cuba are Yuman ($78,055, a difference of 0.25%), Immigrants from Yemen ($77,457, a difference of 1.0%), Pima ($77,431, a difference of 1.1%), Hopi ($77,188, a difference of 1.4%), and Menominee ($79,563, a difference of 1.7%).
| Demographics | Rating | Rank | Median Family Income |
| Sioux | 0.0 /100 | #325 | Tragic $82,386 |
| Immigrants | Congo | 0.0 /100 | #326 | Tragic $82,216 |
| Arapaho | 0.0 /100 | #327 | Tragic $82,064 |
| Blacks/African Americans | 0.0 /100 | #328 | Tragic $81,912 |
| Dutch West Indians | 0.0 /100 | #329 | Tragic $81,852 |
| Cheyenne | 0.0 /100 | #330 | Tragic $81,385 |
| Immigrants | Dominican Republic | 0.0 /100 | #331 | Tragic $81,233 |
| Natives/Alaskans | 0.0 /100 | #332 | Tragic $80,908 |
| Kiowa | 0.0 /100 | #333 | Tragic $80,885 |
| Menominee | 0.0 /100 | #334 | Tragic $79,563 |
| Yup'ik | 0.0 /100 | #335 | Tragic $79,290 |
| Immigrants | Cuba | 0.0 /100 | #336 | Tragic $78,249 |
| Yuman | 0.0 /100 | #337 | Tragic $78,055 |
| Immigrants | Yemen | 0.0 /100 | #338 | Tragic $77,457 |
| Pima | 0.0 /100 | #339 | Tragic $77,431 |
| Hopi | 0.0 /100 | #340 | Tragic $77,188 |
| Pueblo | 0.0 /100 | #341 | Tragic $76,880 |
| Crow | 0.0 /100 | #342 | Tragic $76,605 |
| Houma | 0.0 /100 | #343 | Tragic $76,188 |
| Tohono O'odham | 0.0 /100 | #344 | Tragic $72,193 |
| Navajo | 0.0 /100 | #345 | Tragic $70,989 |