Delaware vs Immigrants from Cuba Median Family Income
COMPARE
Delaware
Immigrants from Cuba
Median Family Income
Median Family Income Comparison
Delaware
Immigrants from Cuba
$96,958
MEDIAN FAMILY INCOME
5.1/ 100
METRIC RATING
219th/ 347
METRIC RANK
$78,249
MEDIAN FAMILY INCOME
0.0/ 100
METRIC RATING
336th/ 347
METRIC RANK
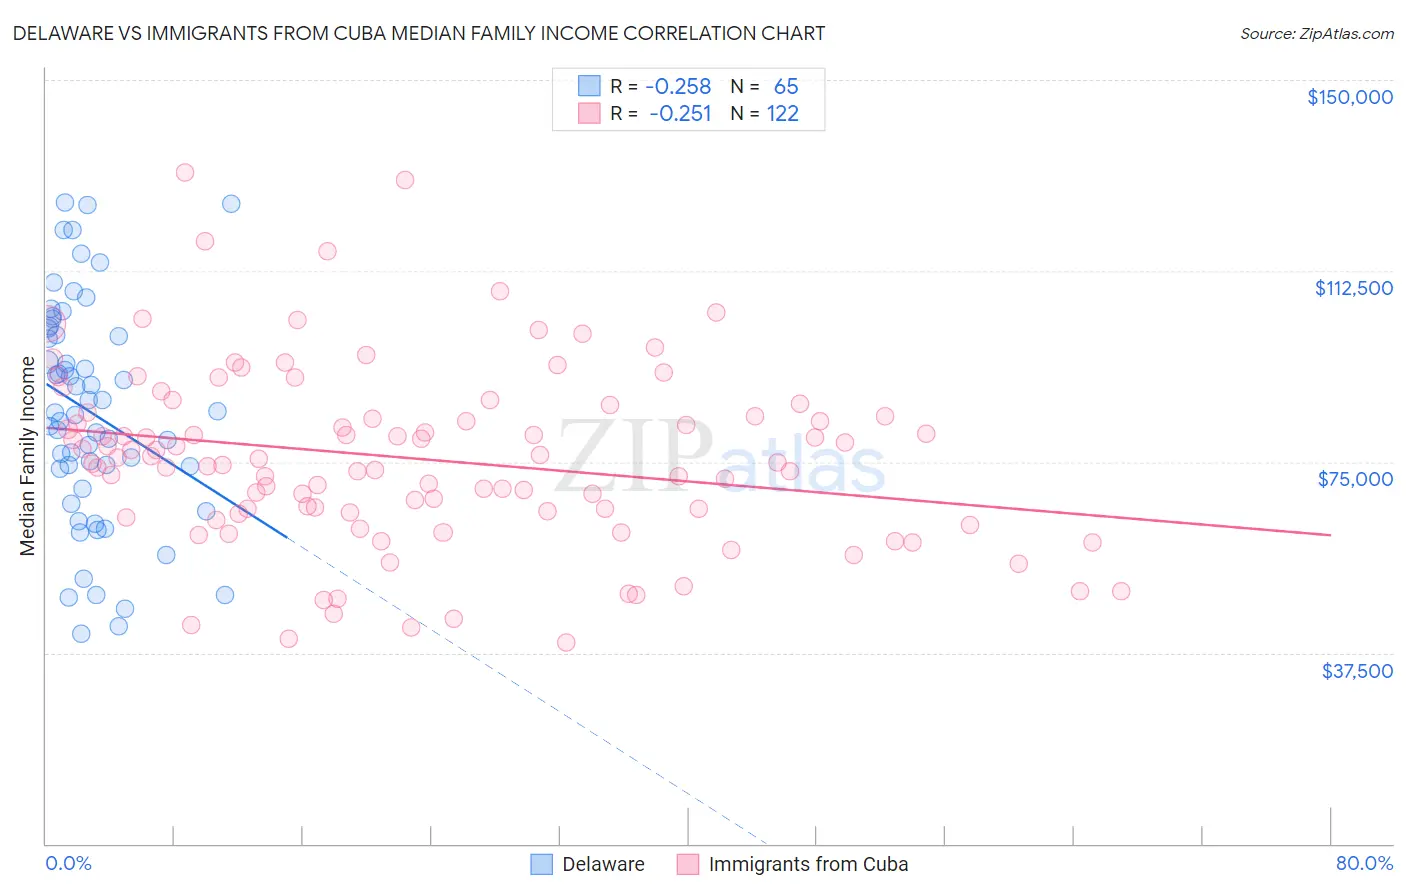
Delaware vs Immigrants from Cuba Median Family Income Correlation Chart
The statistical analysis conducted on geographies consisting of 96,215,498 people shows a weak negative correlation between the proportion of Delaware and median family income in the United States with a correlation coefficient (R) of -0.258 and weighted average of $96,958. Similarly, the statistical analysis conducted on geographies consisting of 325,826,414 people shows a weak negative correlation between the proportion of Immigrants from Cuba and median family income in the United States with a correlation coefficient (R) of -0.251 and weighted average of $78,249, a difference of 23.9%.
Median Family Income Correlation Summary
| Measurement | Delaware | Immigrants from Cuba |
| Minimum | $41,165 | $39,559 |
| Maximum | $125,926 | $131,935 |
| Range | $84,761 | $92,376 |
| Mean | $84,700 | $75,634 |
| Median | $84,783 | $75,235 |
| Interquartile 25% (IQ1) | $71,717 | $64,988 |
| Interquartile 75% (IQ3) | $100,612 | $83,903 |
| Interquartile Range (IQR) | $28,895 | $18,915 |
| Standard Deviation (Sample) | $21,556 | $17,632 |
| Standard Deviation (Population) | $21,389 | $17,559 |
Similar Demographics by Median Family Income
Demographics Similar to Delaware by Median Family Income
In terms of median family income, the demographic groups most similar to Delaware are Sudanese ($96,783, a difference of 0.18%), Immigrants from Cambodia ($97,222, a difference of 0.27%), Japanese ($97,288, a difference of 0.34%), Immigrants from Ghana ($96,544, a difference of 0.43%), and Immigrants from Bosnia and Herzegovina ($97,432, a difference of 0.49%).
| Demographics | Rating | Rank | Median Family Income |
| Panamanians | 7.2 /100 | #212 | Tragic $97,683 |
| Immigrants | Armenia | 7.0 /100 | #213 | Tragic $97,605 |
| Bermudans | 6.9 /100 | #214 | Tragic $97,577 |
| Nigerians | 6.7 /100 | #215 | Tragic $97,522 |
| Immigrants | Bosnia and Herzegovina | 6.4 /100 | #216 | Tragic $97,432 |
| Japanese | 6.0 /100 | #217 | Tragic $97,288 |
| Immigrants | Cambodia | 5.8 /100 | #218 | Tragic $97,222 |
| Delaware | 5.1 /100 | #219 | Tragic $96,958 |
| Sudanese | 4.7 /100 | #220 | Tragic $96,783 |
| Immigrants | Ghana | 4.2 /100 | #221 | Tragic $96,544 |
| Immigrants | Nigeria | 4.0 /100 | #222 | Tragic $96,439 |
| Venezuelans | 3.7 /100 | #223 | Tragic $96,281 |
| Immigrants | Nonimmigrants | 3.6 /100 | #224 | Tragic $96,231 |
| Vietnamese | 3.4 /100 | #225 | Tragic $96,123 |
| Immigrants | Panama | 2.7 /100 | #226 | Tragic $95,647 |
Demographics Similar to Immigrants from Cuba by Median Family Income
In terms of median family income, the demographic groups most similar to Immigrants from Cuba are Yuman ($78,055, a difference of 0.25%), Immigrants from Yemen ($77,457, a difference of 1.0%), Pima ($77,431, a difference of 1.1%), Yup'ik ($79,290, a difference of 1.3%), and Hopi ($77,188, a difference of 1.4%).
| Demographics | Rating | Rank | Median Family Income |
| Dutch West Indians | 0.0 /100 | #329 | Tragic $81,852 |
| Cheyenne | 0.0 /100 | #330 | Tragic $81,385 |
| Immigrants | Dominican Republic | 0.0 /100 | #331 | Tragic $81,233 |
| Natives/Alaskans | 0.0 /100 | #332 | Tragic $80,908 |
| Kiowa | 0.0 /100 | #333 | Tragic $80,885 |
| Menominee | 0.0 /100 | #334 | Tragic $79,563 |
| Yup'ik | 0.0 /100 | #335 | Tragic $79,290 |
| Immigrants | Cuba | 0.0 /100 | #336 | Tragic $78,249 |
| Yuman | 0.0 /100 | #337 | Tragic $78,055 |
| Immigrants | Yemen | 0.0 /100 | #338 | Tragic $77,457 |
| Pima | 0.0 /100 | #339 | Tragic $77,431 |
| Hopi | 0.0 /100 | #340 | Tragic $77,188 |
| Pueblo | 0.0 /100 | #341 | Tragic $76,880 |
| Crow | 0.0 /100 | #342 | Tragic $76,605 |
| Houma | 0.0 /100 | #343 | Tragic $76,188 |