Yup'ik vs Immigrants from Belgium Median Family Income

COMPARE

Yup'ik
Race
Ancestry
AfghanAfricanAlaska NativeAlaskan AthabascanAlbanianAleutAlsatianAmericanApacheArabArapahoArgentineanArmenianAssyrian/Chaldean/SyriacAustralianAustrianBahamianBangladeshiBarbadianBasqueBelgianBelizeanBermudanBhutaneseBlackfeetBolivianBrazilianBritishBritish West IndianBulgarianBurmeseCajunCambodianCanadianCape VerdeanCarpatho RusynCelticCentral AmericanCentral American IndianCherokeeCheyenneChickasawChileanChineseChippewaChoctawColombianColvilleComancheCosta RicanCreeCreekCroatianCrowCubanCypriotCzechCzechoslovakianDanishDelawareDominicanDutchDutch West IndianEastern EuropeanEcuadorianEgyptianEnglishEstonianEthiopianEuropeanFijianFilipinoFinnishFrenchFrench American IndianFrench CanadianGermanGerman RussianGhanaianGreekGuamanian/ChamorroGuatemalanGuyaneseHaitianHmongHonduranHopiHoumaHungarianIcelanderIndian (Asian)IndonesianInupiatIranianIraqiIrishIroquoisIsraeliItalianJamaicanJapaneseJordanianKenyanKiowaKoreanLaotianLatvianLebaneseLiberianLithuanianLumbeeLuxembourgerMacedonianMalaysianMalteseMarshalleseMenomineeMexicanMexican American IndianMongolianMoroccanNative HawaiianNavajoNepaleseNew ZealanderNicaraguanNigerianNorthern EuropeanNorwegianOkinawanOsageOttawaPaiutePakistaniPalestinianPanamanianParaguayanPennsylvania GermanPeruvianPimaPolishPortuguesePotawatomiPuebloPuerto RicanPuget Sound SalishRomanianRussianSalvadoranSamoanScandinavianScotch-IrishScottishSeminoleSenegaleseSerbianShoshoneSierra LeoneanSiouxSlavicSlovakSloveneSomaliSouth AfricanSouth AmericanSouth American IndianSoviet UnionSpaniardSpanishSpanish AmericanSpanish American IndianSri LankanSubsaharan AfricanSudaneseSwedishSwissSyrianTaiwaneseThaiTlingit-HaidaTohono O'OdhamTonganTrinidadian and TobagonianTsimshianTurkishU.S. Virgin IslanderUgandanUkrainianUruguayanUteVenezuelanVietnameseWelshWest IndianYakamaYaquiYugoslavianYumanYup'ikZimbabwean
Immigration
NonimmigrantsImmigrantsAfghanistanAfricaAlbaniaArgentinaArmeniaAsiaAustraliaAustriaBahamasBangladeshBarbadosBelarusBelizeBoliviaBosnia and HerzegovinaBrazilBulgariaBurma/MyanmarCabo VerdeCambodiaCameroonCanadaCaribbeanCentral AmericaChileChinaColombiaCongoCosta RicaCroatiaCubaCzechoslovakiaDenmarkDominicaDominican RepublicEastern AfricaEastern AsiaEastern EuropeEcuadorEgyptEl SalvadorEnglandEritreaEthiopiaEuropeFijiFranceGermanyGhanaGreeceGrenadaGuatemalaGuyanaHaitiHondurasHong KongHungaryIndiaIndonesiaIranIraqIrelandIsraelItalyJamaicaJapanJordanKazakhstanKenyaKoreaKuwaitLaosLatin AmericaLatviaLebanonLiberiaLithuaniaMalaysiaMexicoMicronesiaMiddle AfricaMoldovaMoroccoNepalNetherlandsNicaraguaNigeriaNorth AmericaNorth MacedoniaNorthern AfricaNorthern EuropeNorwayOceaniaPakistanPanamaPeruPhilippinesPolandPortugalRomaniaRussiaSaudi ArabiaScotlandSenegalSerbiaSierra LeoneSingaporeSomaliaSouth AfricaSouth AmericaSouth Central AsiaSouth Eastern AsiaSouthern EuropeSpainSri LankaSt. Vincent and the GrenadinesSudanSwedenSwitzerlandSyriaTaiwanThailandTrinidad and TobagoTurkeyUgandaUkraineUruguayUzbekistanVenezuelaVietnamWest IndiesWestern AfricaWestern AsiaWestern EuropeYemenZaireZimbabweAzores
Immigrants from Belgium
Race
Ancestry
AfghanAfricanAlaska NativeAlaskan AthabascanAlbanianAleutAlsatianAmericanApacheArabArapahoArgentineanArmenianAssyrian/Chaldean/SyriacAustralianAustrianBahamianBangladeshiBarbadianBasqueBelgianBelizeanBermudanBhutaneseBlackfeetBolivianBrazilianBritishBritish West IndianBulgarianBurmeseCajunCambodianCanadianCape VerdeanCarpatho RusynCelticCentral AmericanCentral American IndianCherokeeCheyenneChickasawChileanChineseChippewaChoctawColombianColvilleComancheCosta RicanCreeCreekCroatianCrowCubanCypriotCzechCzechoslovakianDanishDelawareDominicanDutchDutch West IndianEastern EuropeanEcuadorianEgyptianEnglishEstonianEthiopianEuropeanFijianFilipinoFinnishFrenchFrench American IndianFrench CanadianGermanGerman RussianGhanaianGreekGuamanian/ChamorroGuatemalanGuyaneseHaitianHmongHonduranHopiHoumaHungarianIcelanderIndian (Asian)IndonesianInupiatIranianIraqiIrishIroquoisIsraeliItalianJamaicanJapaneseJordanianKenyanKiowaKoreanLaotianLatvianLebaneseLiberianLithuanianLumbeeLuxembourgerMacedonianMalaysianMalteseMarshalleseMenomineeMexicanMexican American IndianMongolianMoroccanNative HawaiianNavajoNepaleseNew ZealanderNicaraguanNigerianNorthern EuropeanNorwegianOkinawanOsageOttawaPaiutePakistaniPalestinianPanamanianParaguayanPennsylvania GermanPeruvianPimaPolishPortuguesePotawatomiPuebloPuerto RicanPuget Sound SalishRomanianRussianSalvadoranSamoanScandinavianScotch-IrishScottishSeminoleSenegaleseSerbianShoshoneSierra LeoneanSiouxSlavicSlovakSloveneSomaliSouth AfricanSouth AmericanSouth American IndianSoviet UnionSpaniardSpanishSpanish AmericanSpanish American IndianSri LankanSubsaharan AfricanSudaneseSwedishSwissSyrianTaiwaneseThaiTlingit-HaidaTohono O'OdhamTonganTrinidadian and TobagonianTsimshianTurkishU.S. Virgin IslanderUgandanUkrainianUruguayanUteVenezuelanVietnameseWelshWest IndianYakamaYaquiYugoslavianYumanZimbabwean
Immigration
NonimmigrantsImmigrantsAfghanistanAfricaAlbaniaArgentinaArmeniaAsiaAustraliaAustriaBahamasBangladeshBarbadosBelarusBelgiumBelizeBoliviaBosnia and HerzegovinaBrazilBulgariaBurma/MyanmarCabo VerdeCambodiaCameroonCanadaCaribbeanCentral AmericaChileChinaColombiaCongoCosta RicaCroatiaCubaCzechoslovakiaDenmarkDominicaDominican RepublicEastern AfricaEastern AsiaEastern EuropeEcuadorEgyptEl SalvadorEnglandEritreaEthiopiaEuropeFijiFranceGermanyGhanaGreeceGrenadaGuatemalaGuyanaHaitiHondurasHong KongHungaryIndiaIndonesiaIranIraqIrelandIsraelItalyJamaicaJapanJordanKazakhstanKenyaKoreaKuwaitLaosLatin AmericaLatviaLebanonLiberiaLithuaniaMalaysiaMexicoMicronesiaMiddle AfricaMoldovaMoroccoNepalNetherlandsNicaraguaNigeriaNorth AmericaNorth MacedoniaNorthern AfricaNorthern EuropeNorwayOceaniaPakistanPanamaPeruPhilippinesPolandPortugalRomaniaRussiaSaudi ArabiaScotlandSenegalSerbiaSierra LeoneSingaporeSomaliaSouth AfricaSouth AmericaSouth Central AsiaSouth Eastern AsiaSouthern EuropeSpainSri LankaSt. Vincent and the GrenadinesSudanSwedenSwitzerlandSyriaTaiwanThailandTrinidad and TobagoTurkeyUgandaUkraineUruguayUzbekistanVenezuelaVietnamWest IndiesWestern AfricaWestern AsiaWestern EuropeYemenZaireZimbabweAzores
Median Family Income
Income
Poverty
Unemployment
Labor Participation
Family Structure
Vehicle Availability
Education Level
Disability

Median Family Income Comparison

Yup'ik

Immigrants from Belgium

Tragic
Exceptional
$79,290
MEDIAN FAMILY INCOME
0.0/ 100
METRIC RATING
335th/ 347
METRIC RANK
$123,831
MEDIAN FAMILY INCOME
100.0/ 100
METRIC RATING
19th/ 347
METRIC RANK

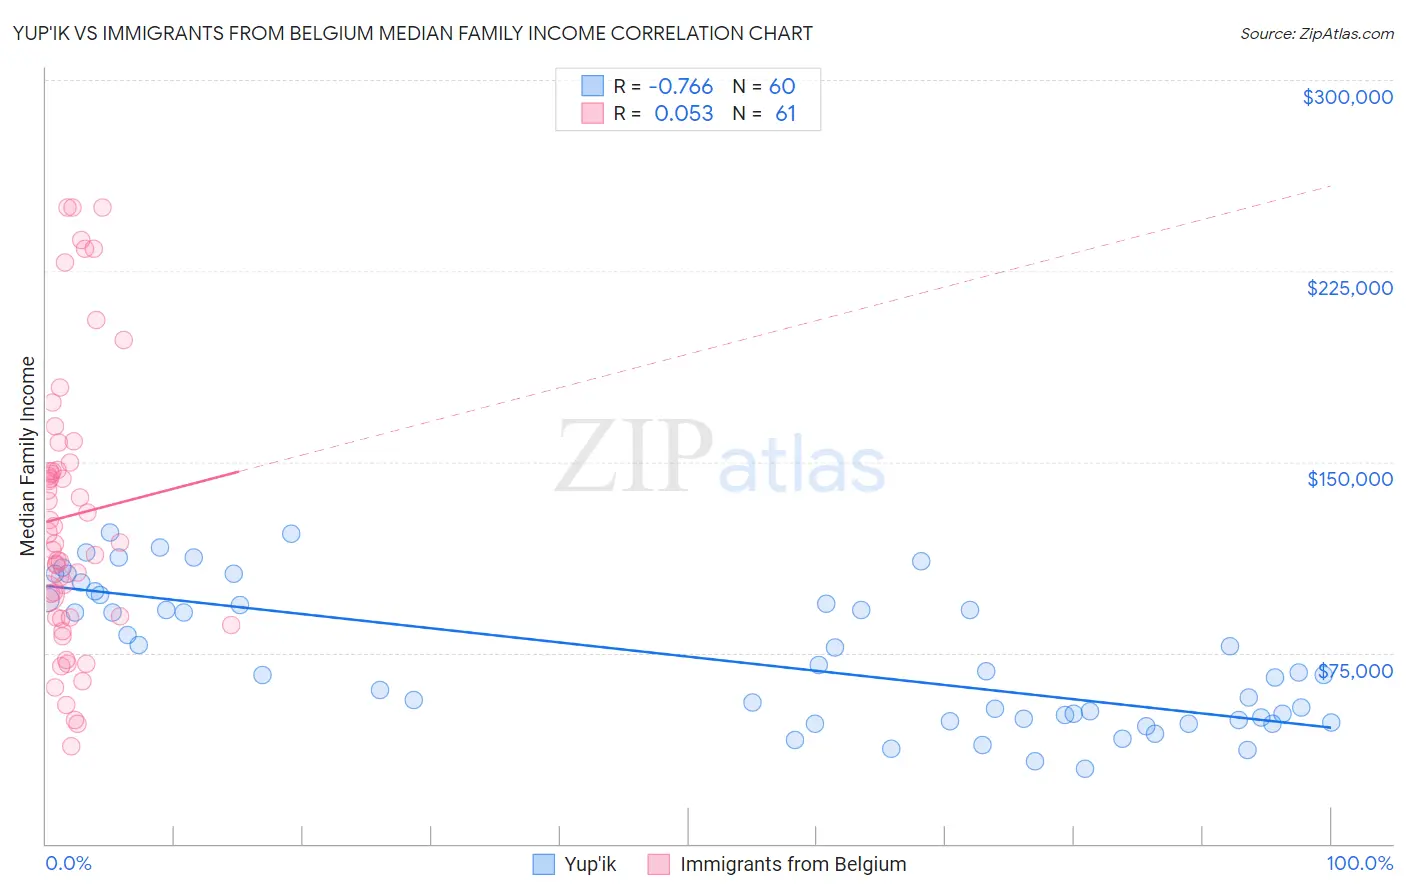
Yup'ik vs Immigrants from Belgium Median Family Income Correlation Chart

The statistical analysis conducted on geographies consisting of 39,952,310 people shows a strong negative correlation between the proportion of Yup'ik and median family income in the United States with a correlation coefficient (R) of -0.766 and weighted average of $79,290. Similarly, the statistical analysis conducted on geographies consisting of 146,657,089 people shows a slight positive correlation between the proportion of Immigrants from Belgium and median family income in the United States with a correlation coefficient (R) of 0.053 and weighted average of $123,831, a difference of 56.2%.
Yup'ik vs Immigrants from Belgium Median Family Income

Median Family Income Correlation Summary

MeasurementYup'ikImmigrants from Belgium
Minimum$29,250$38,056
Maximum$122,399$250,001
Range$93,149$211,945
Mean$72,637$128,845
Median$66,875$118,563
Interquartile 25% (IQ1)$48,824$88,684
Interquartile 75% (IQ3)$95,045$148,325
Interquartile Range (IQR)$46,221$59,642
Standard Deviation (Sample)$27,024$54,287
Standard Deviation (Population)$26,798$53,840

Similar Demographics by Median Family Income

Demographics Similar to Yup'ik by Median Family Income

In terms of median family income, the demographic groups most similar to Yup'ik are Menominee ($79,563, a difference of 0.34%), Immigrants from Cuba ($78,249, a difference of 1.3%), Yuman ($78,055, a difference of 1.6%), Kiowa ($80,885, a difference of 2.0%), and Native/Alaskan ($80,908, a difference of 2.0%).
DemographicsRating | RankMedian Family Income
Blacks/African Americans
0.0
/100
|
#328
Tragic
$81,912
Dutch West Indians
0.0
/100
|
#329
Tragic
$81,852
Cheyenne
0.0
/100
|
#330
Tragic
$81,385
Immigrants | Dominican Republic
0.0
/100
|
#331
Tragic
$81,233
Natives/Alaskans
0.0
/100
|
#332
Tragic
$80,908
Kiowa
0.0
/100
|
#333
Tragic
$80,885
Menominee
0.0
/100
|
#334
Tragic
$79,563
Yup'ik
0.0
/100
|
#335
Tragic
$79,290
Immigrants | Cuba
0.0
/100
|
#336
Tragic
$78,249
Yuman
0.0
/100
|
#337
Tragic
$78,055
Immigrants | Yemen
0.0
/100
|
#338
Tragic
$77,457
Pima
0.0
/100
|
#339
Tragic
$77,431
Hopi
0.0
/100
|
#340
Tragic
$77,188
Pueblo
0.0
/100
|
#341
Tragic
$76,880
Crow
0.0
/100
|
#342
Tragic
$76,605

Demographics Similar to Immigrants from Belgium by Median Family Income

In terms of median family income, the demographic groups most similar to Immigrants from Belgium are Burmese ($123,369, a difference of 0.37%), Immigrants from Korea ($122,800, a difference of 0.84%), Immigrants from Sweden ($122,765, a difference of 0.87%), Immigrants from Japan ($122,764, a difference of 0.87%), and Immigrants from Eastern Asia ($125,150, a difference of 1.1%).
DemographicsRating | RankMedian Family Income
Cypriots
100.0
/100
|
#12
Exceptional
$127,064
Immigrants | Australia
100.0
/100
|
#13
Exceptional
$126,620
Immigrants | South Central Asia
100.0
/100
|
#14
Exceptional
$125,956
Eastern Europeans
100.0
/100
|
#15
Exceptional
$125,546
Immigrants | China
100.0
/100
|
#16
Exceptional
$125,540
Indians (Asian)
100.0
/100
|
#17
Exceptional
$125,312
Immigrants | Eastern Asia
100.0
/100
|
#18
Exceptional
$125,150
Immigrants | Belgium
100.0
/100
|
#19
Exceptional
$123,831
Burmese
100.0
/100
|
#20
Exceptional
$123,369
Immigrants | Korea
100.0
/100
|
#21
Exceptional
$122,800
Immigrants | Sweden
100.0
/100
|
#22
Exceptional
$122,765
Immigrants | Japan
100.0
/100
|
#23
Exceptional
$122,764
Immigrants | Northern Europe
100.0
/100
|
#24
Exceptional
$121,840
Turks
100.0
/100
|
#25
Exceptional
$121,202
Immigrants | Switzerland
100.0
/100
|
#26
Exceptional
$120,726