Croatian vs Immigrants from Cuba Median Family Income
COMPARE
Croatian
Immigrants from Cuba
Median Family Income
Median Family Income Comparison
Croatians
Immigrants from Cuba
$111,370
MEDIAN FAMILY INCOME
98.8/ 100
METRIC RATING
85th/ 347
METRIC RANK
$78,249
MEDIAN FAMILY INCOME
0.0/ 100
METRIC RATING
336th/ 347
METRIC RANK
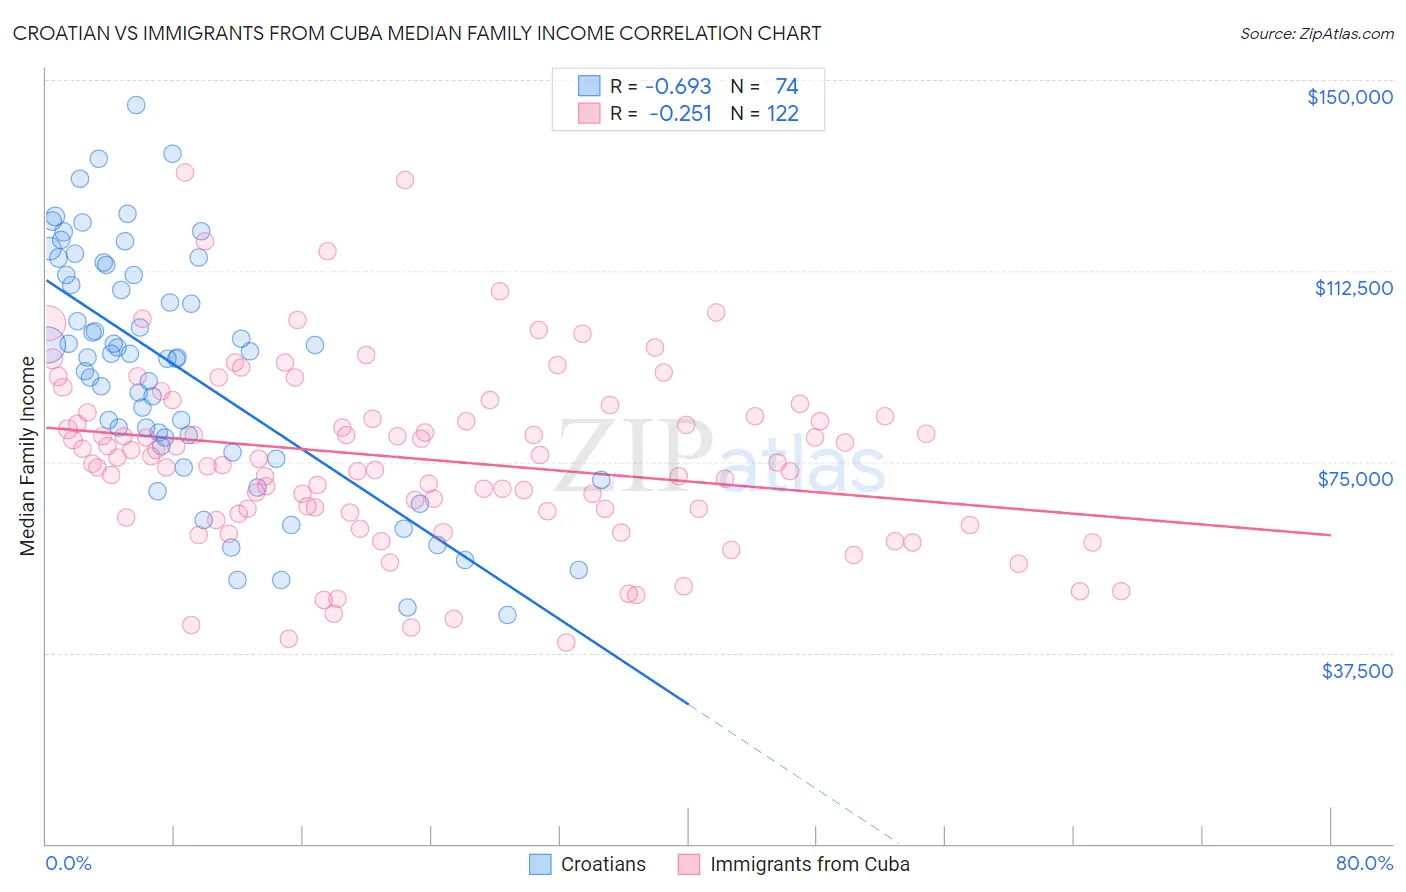
Croatian vs Immigrants from Cuba Median Family Income Correlation Chart
The statistical analysis conducted on geographies consisting of 375,427,421 people shows a significant negative correlation between the proportion of Croatians and median family income in the United States with a correlation coefficient (R) of -0.693 and weighted average of $111,370. Similarly, the statistical analysis conducted on geographies consisting of 325,826,414 people shows a weak negative correlation between the proportion of Immigrants from Cuba and median family income in the United States with a correlation coefficient (R) of -0.251 and weighted average of $78,249, a difference of 42.3%.
Median Family Income Correlation Summary
| Measurement | Croatian | Immigrants from Cuba |
| Minimum | $44,806 | $39,559 |
| Maximum | $145,180 | $131,935 |
| Range | $100,374 | $92,376 |
| Mean | $93,423 | $75,634 |
| Median | $95,958 | $75,235 |
| Interquartile 25% (IQ1) | $78,056 | $64,988 |
| Interquartile 75% (IQ3) | $111,742 | $83,903 |
| Interquartile Range (IQR) | $33,686 | $18,915 |
| Standard Deviation (Sample) | $23,244 | $17,632 |
| Standard Deviation (Population) | $23,087 | $17,559 |
Similar Demographics by Median Family Income
Demographics Similar to Croatians by Median Family Income
In terms of median family income, the demographic groups most similar to Croatians are Ukrainian ($111,368, a difference of 0.0%), Immigrants from Hungary ($111,378, a difference of 0.010%), Austrian ($111,306, a difference of 0.060%), Romanian ($111,243, a difference of 0.11%), and Immigrants from Egypt ($111,689, a difference of 0.29%).
| Demographics | Rating | Rank | Median Family Income |
| Immigrants | Canada | 99.3 /100 | #78 | Exceptional $112,374 |
| Italians | 99.3 /100 | #79 | Exceptional $112,372 |
| Immigrants | Croatia | 99.3 /100 | #80 | Exceptional $112,323 |
| Immigrants | North America | 99.2 /100 | #81 | Exceptional $112,151 |
| Immigrants | England | 99.2 /100 | #82 | Exceptional $112,038 |
| Immigrants | Egypt | 99.0 /100 | #83 | Exceptional $111,689 |
| Immigrants | Hungary | 98.8 /100 | #84 | Exceptional $111,378 |
| Croatians | 98.8 /100 | #85 | Exceptional $111,370 |
| Ukrainians | 98.8 /100 | #86 | Exceptional $111,368 |
| Austrians | 98.8 /100 | #87 | Exceptional $111,306 |
| Romanians | 98.8 /100 | #88 | Exceptional $111,243 |
| Immigrants | Argentina | 98.5 /100 | #89 | Exceptional $110,873 |
| Northern Europeans | 98.3 /100 | #90 | Exceptional $110,635 |
| Immigrants | Southern Europe | 98.3 /100 | #91 | Exceptional $110,614 |
| Immigrants | Lebanon | 97.9 /100 | #92 | Exceptional $110,159 |
Demographics Similar to Immigrants from Cuba by Median Family Income
In terms of median family income, the demographic groups most similar to Immigrants from Cuba are Yuman ($78,055, a difference of 0.25%), Immigrants from Yemen ($77,457, a difference of 1.0%), Pima ($77,431, a difference of 1.1%), Yup'ik ($79,290, a difference of 1.3%), and Hopi ($77,188, a difference of 1.4%).
| Demographics | Rating | Rank | Median Family Income |
| Dutch West Indians | 0.0 /100 | #329 | Tragic $81,852 |
| Cheyenne | 0.0 /100 | #330 | Tragic $81,385 |
| Immigrants | Dominican Republic | 0.0 /100 | #331 | Tragic $81,233 |
| Natives/Alaskans | 0.0 /100 | #332 | Tragic $80,908 |
| Kiowa | 0.0 /100 | #333 | Tragic $80,885 |
| Menominee | 0.0 /100 | #334 | Tragic $79,563 |
| Yup'ik | 0.0 /100 | #335 | Tragic $79,290 |
| Immigrants | Cuba | 0.0 /100 | #336 | Tragic $78,249 |
| Yuman | 0.0 /100 | #337 | Tragic $78,055 |
| Immigrants | Yemen | 0.0 /100 | #338 | Tragic $77,457 |
| Pima | 0.0 /100 | #339 | Tragic $77,431 |
| Hopi | 0.0 /100 | #340 | Tragic $77,188 |
| Pueblo | 0.0 /100 | #341 | Tragic $76,880 |
| Crow | 0.0 /100 | #342 | Tragic $76,605 |
| Houma | 0.0 /100 | #343 | Tragic $76,188 |