Sri Lankan vs Immigrants from Cuba Median Family Income
COMPARE
Sri Lankan
Immigrants from Cuba
Median Family Income
Median Family Income Comparison
Sri Lankans
Immigrants from Cuba
$108,234
MEDIAN FAMILY INCOME
94.5/ 100
METRIC RATING
119th/ 347
METRIC RANK
$78,249
MEDIAN FAMILY INCOME
0.0/ 100
METRIC RATING
336th/ 347
METRIC RANK
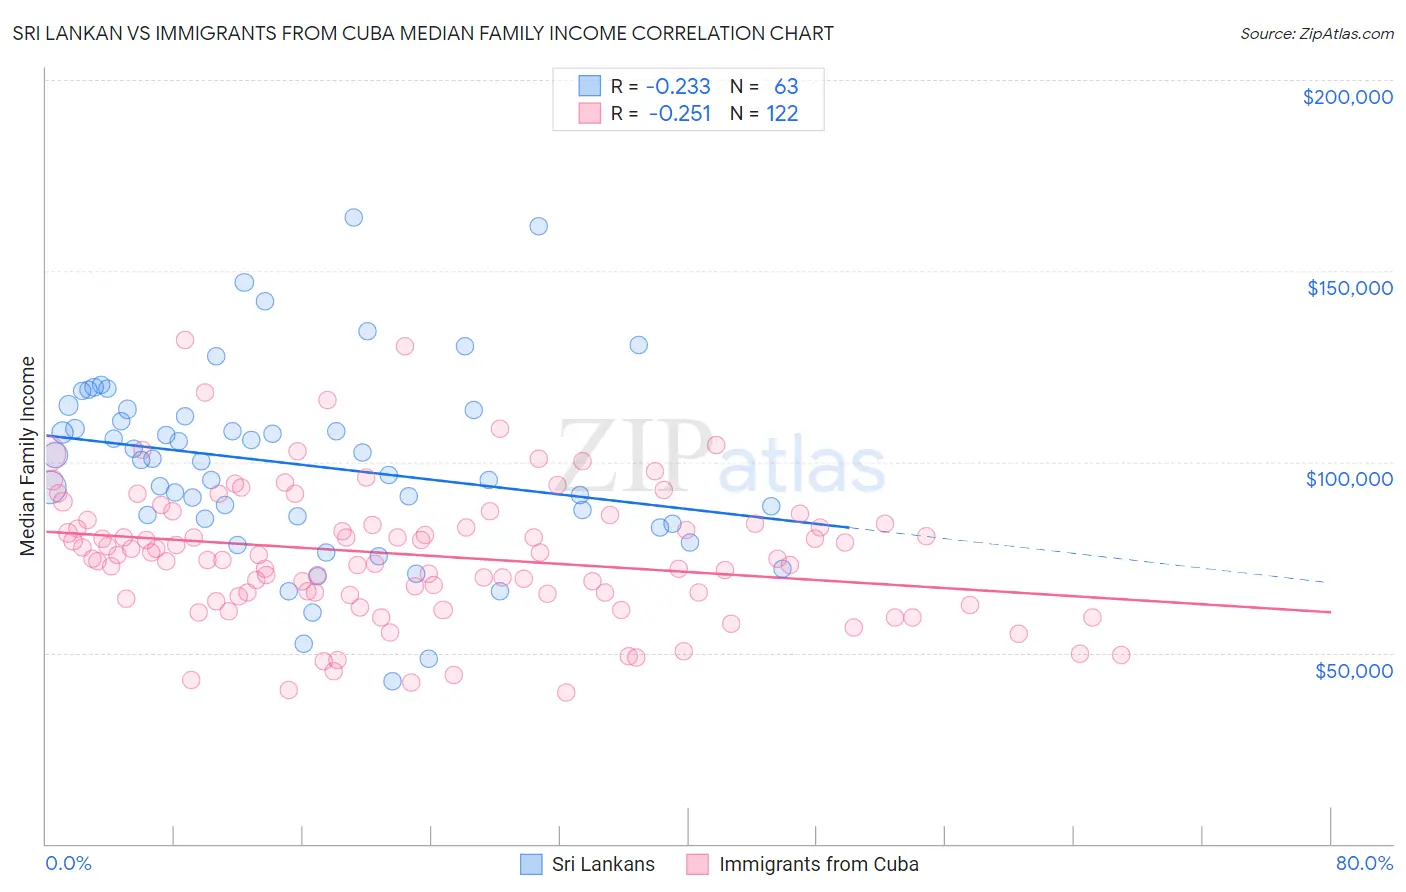
Sri Lankan vs Immigrants from Cuba Median Family Income Correlation Chart
The statistical analysis conducted on geographies consisting of 439,902,823 people shows a weak negative correlation between the proportion of Sri Lankans and median family income in the United States with a correlation coefficient (R) of -0.233 and weighted average of $108,234. Similarly, the statistical analysis conducted on geographies consisting of 325,826,414 people shows a weak negative correlation between the proportion of Immigrants from Cuba and median family income in the United States with a correlation coefficient (R) of -0.251 and weighted average of $78,249, a difference of 38.3%.
Median Family Income Correlation Summary
| Measurement | Sri Lankan | Immigrants from Cuba |
| Minimum | $42,404 | $39,559 |
| Maximum | $164,143 | $131,935 |
| Range | $121,739 | $92,376 |
| Mean | $99,316 | $75,634 |
| Median | $100,475 | $75,235 |
| Interquartile 25% (IQ1) | $84,952 | $64,988 |
| Interquartile 75% (IQ3) | $113,711 | $83,903 |
| Interquartile Range (IQR) | $28,760 | $18,915 |
| Standard Deviation (Sample) | $24,633 | $17,632 |
| Standard Deviation (Population) | $24,437 | $17,559 |
Similar Demographics by Median Family Income
Demographics Similar to Sri Lankans by Median Family Income
In terms of median family income, the demographic groups most similar to Sri Lankans are Ethiopian ($108,251, a difference of 0.020%), Immigrants from Philippines ($108,288, a difference of 0.050%), Immigrants from Northern Africa ($108,161, a difference of 0.070%), European ($108,099, a difference of 0.12%), and Chilean ($108,429, a difference of 0.18%).
| Demographics | Rating | Rank | Median Family Income |
| Immigrants | Poland | 95.3 /100 | #112 | Exceptional $108,570 |
| Immigrants | Saudi Arabia | 95.2 /100 | #113 | Exceptional $108,544 |
| Poles | 95.2 /100 | #114 | Exceptional $108,507 |
| Swedes | 95.1 /100 | #115 | Exceptional $108,499 |
| Chileans | 95.0 /100 | #116 | Exceptional $108,429 |
| Immigrants | Philippines | 94.6 /100 | #117 | Exceptional $108,288 |
| Ethiopians | 94.5 /100 | #118 | Exceptional $108,251 |
| Sri Lankans | 94.5 /100 | #119 | Exceptional $108,234 |
| Immigrants | Northern Africa | 94.3 /100 | #120 | Exceptional $108,161 |
| Europeans | 94.1 /100 | #121 | Exceptional $108,099 |
| Immigrants | Jordan | 92.9 /100 | #122 | Exceptional $107,715 |
| Carpatho Rusyns | 92.2 /100 | #123 | Exceptional $107,502 |
| Pakistanis | 91.7 /100 | #124 | Exceptional $107,390 |
| Taiwanese | 91.4 /100 | #125 | Exceptional $107,295 |
| Serbians | 90.8 /100 | #126 | Exceptional $107,157 |
Demographics Similar to Immigrants from Cuba by Median Family Income
In terms of median family income, the demographic groups most similar to Immigrants from Cuba are Yuman ($78,055, a difference of 0.25%), Immigrants from Yemen ($77,457, a difference of 1.0%), Pima ($77,431, a difference of 1.1%), Yup'ik ($79,290, a difference of 1.3%), and Hopi ($77,188, a difference of 1.4%).
| Demographics | Rating | Rank | Median Family Income |
| Dutch West Indians | 0.0 /100 | #329 | Tragic $81,852 |
| Cheyenne | 0.0 /100 | #330 | Tragic $81,385 |
| Immigrants | Dominican Republic | 0.0 /100 | #331 | Tragic $81,233 |
| Natives/Alaskans | 0.0 /100 | #332 | Tragic $80,908 |
| Kiowa | 0.0 /100 | #333 | Tragic $80,885 |
| Menominee | 0.0 /100 | #334 | Tragic $79,563 |
| Yup'ik | 0.0 /100 | #335 | Tragic $79,290 |
| Immigrants | Cuba | 0.0 /100 | #336 | Tragic $78,249 |
| Yuman | 0.0 /100 | #337 | Tragic $78,055 |
| Immigrants | Yemen | 0.0 /100 | #338 | Tragic $77,457 |
| Pima | 0.0 /100 | #339 | Tragic $77,431 |
| Hopi | 0.0 /100 | #340 | Tragic $77,188 |
| Pueblo | 0.0 /100 | #341 | Tragic $76,880 |
| Crow | 0.0 /100 | #342 | Tragic $76,605 |
| Houma | 0.0 /100 | #343 | Tragic $76,188 |