Alsatian vs Immigrants from Cuba Median Family Income
COMPARE
Alsatian
Immigrants from Cuba
Median Family Income
Median Family Income Comparison
Alsatians
Immigrants from Cuba
$103,010
MEDIAN FAMILY INCOME
54.3/ 100
METRIC RATING
171st/ 347
METRIC RANK
$78,249
MEDIAN FAMILY INCOME
0.0/ 100
METRIC RATING
336th/ 347
METRIC RANK
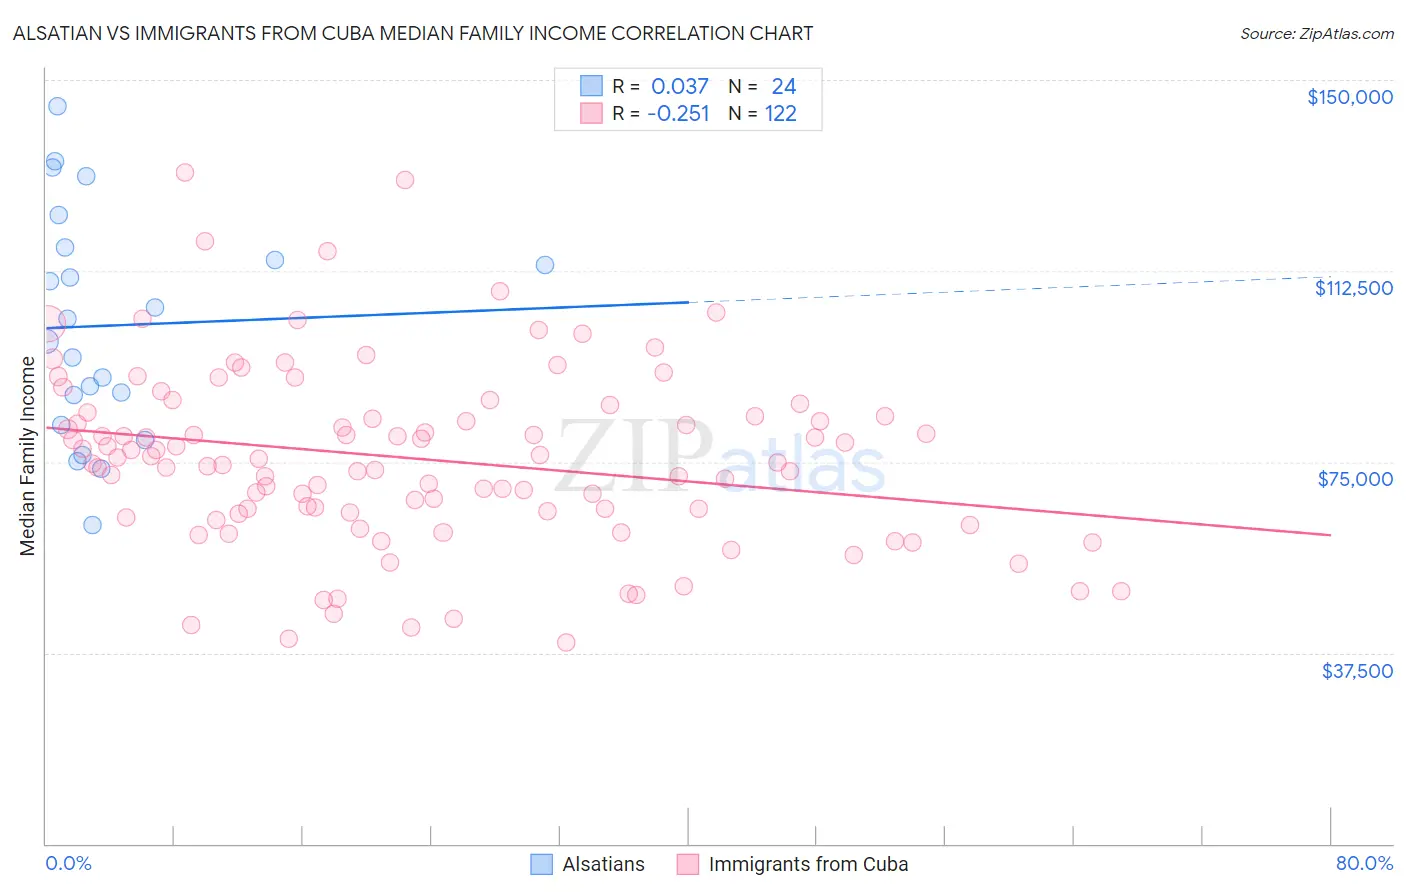
Alsatian vs Immigrants from Cuba Median Family Income Correlation Chart
The statistical analysis conducted on geographies consisting of 82,676,924 people shows no correlation between the proportion of Alsatians and median family income in the United States with a correlation coefficient (R) of 0.037 and weighted average of $103,010. Similarly, the statistical analysis conducted on geographies consisting of 325,826,414 people shows a weak negative correlation between the proportion of Immigrants from Cuba and median family income in the United States with a correlation coefficient (R) of -0.251 and weighted average of $78,249, a difference of 31.6%.
Median Family Income Correlation Summary
| Measurement | Alsatian | Immigrants from Cuba |
| Minimum | $62,500 | $39,559 |
| Maximum | $144,746 | $131,935 |
| Range | $82,246 | $92,376 |
| Mean | $101,763 | $75,634 |
| Median | $100,794 | $75,235 |
| Interquartile 25% (IQ1) | $85,164 | $64,988 |
| Interquartile 75% (IQ3) | $115,830 | $83,903 |
| Interquartile Range (IQR) | $30,667 | $18,915 |
| Standard Deviation (Sample) | $22,004 | $17,632 |
| Standard Deviation (Population) | $21,541 | $17,559 |
Similar Demographics by Median Family Income
Demographics Similar to Alsatians by Median Family Income
In terms of median family income, the demographic groups most similar to Alsatians are Immigrants from Uzbekistan ($103,197, a difference of 0.18%), Immigrants from Eritrea ($102,823, a difference of 0.18%), Belgian ($102,788, a difference of 0.22%), Czechoslovakian ($103,273, a difference of 0.26%), and Finnish ($102,676, a difference of 0.33%).
| Demographics | Rating | Rank | Median Family Income |
| Sierra Leoneans | 64.7 /100 | #164 | Good $103,859 |
| Slovaks | 63.1 /100 | #165 | Good $103,729 |
| English | 62.6 /100 | #166 | Good $103,684 |
| South American Indians | 61.9 /100 | #167 | Good $103,624 |
| Immigrants | Peru | 60.8 /100 | #168 | Good $103,534 |
| Czechoslovakians | 57.6 /100 | #169 | Average $103,273 |
| Immigrants | Uzbekistan | 56.6 /100 | #170 | Average $103,197 |
| Alsatians | 54.3 /100 | #171 | Average $103,010 |
| Immigrants | Eritrea | 51.9 /100 | #172 | Average $102,823 |
| Belgians | 51.4 /100 | #173 | Average $102,788 |
| Finns | 50.0 /100 | #174 | Average $102,676 |
| Immigrants | Eastern Africa | 47.1 /100 | #175 | Average $102,451 |
| French | 46.1 /100 | #176 | Average $102,368 |
| Germans | 44.6 /100 | #177 | Average $102,254 |
| Welsh | 43.3 /100 | #178 | Average $102,151 |
Demographics Similar to Immigrants from Cuba by Median Family Income
In terms of median family income, the demographic groups most similar to Immigrants from Cuba are Yuman ($78,055, a difference of 0.25%), Immigrants from Yemen ($77,457, a difference of 1.0%), Pima ($77,431, a difference of 1.1%), Yup'ik ($79,290, a difference of 1.3%), and Hopi ($77,188, a difference of 1.4%).
| Demographics | Rating | Rank | Median Family Income |
| Dutch West Indians | 0.0 /100 | #329 | Tragic $81,852 |
| Cheyenne | 0.0 /100 | #330 | Tragic $81,385 |
| Immigrants | Dominican Republic | 0.0 /100 | #331 | Tragic $81,233 |
| Natives/Alaskans | 0.0 /100 | #332 | Tragic $80,908 |
| Kiowa | 0.0 /100 | #333 | Tragic $80,885 |
| Menominee | 0.0 /100 | #334 | Tragic $79,563 |
| Yup'ik | 0.0 /100 | #335 | Tragic $79,290 |
| Immigrants | Cuba | 0.0 /100 | #336 | Tragic $78,249 |
| Yuman | 0.0 /100 | #337 | Tragic $78,055 |
| Immigrants | Yemen | 0.0 /100 | #338 | Tragic $77,457 |
| Pima | 0.0 /100 | #339 | Tragic $77,431 |
| Hopi | 0.0 /100 | #340 | Tragic $77,188 |
| Pueblo | 0.0 /100 | #341 | Tragic $76,880 |
| Crow | 0.0 /100 | #342 | Tragic $76,605 |
| Houma | 0.0 /100 | #343 | Tragic $76,188 |