Yup'ik vs Immigrants from Honduras Median Family Income
COMPARE
Yup'ik
Immigrants from Honduras
Median Family Income
Median Family Income Comparison
Yup'ik
Immigrants from Honduras
$79,290
MEDIAN FAMILY INCOME
0.0/ 100
METRIC RATING
335th/ 347
METRIC RANK
$83,618
MEDIAN FAMILY INCOME
0.0/ 100
METRIC RATING
319th/ 347
METRIC RANK
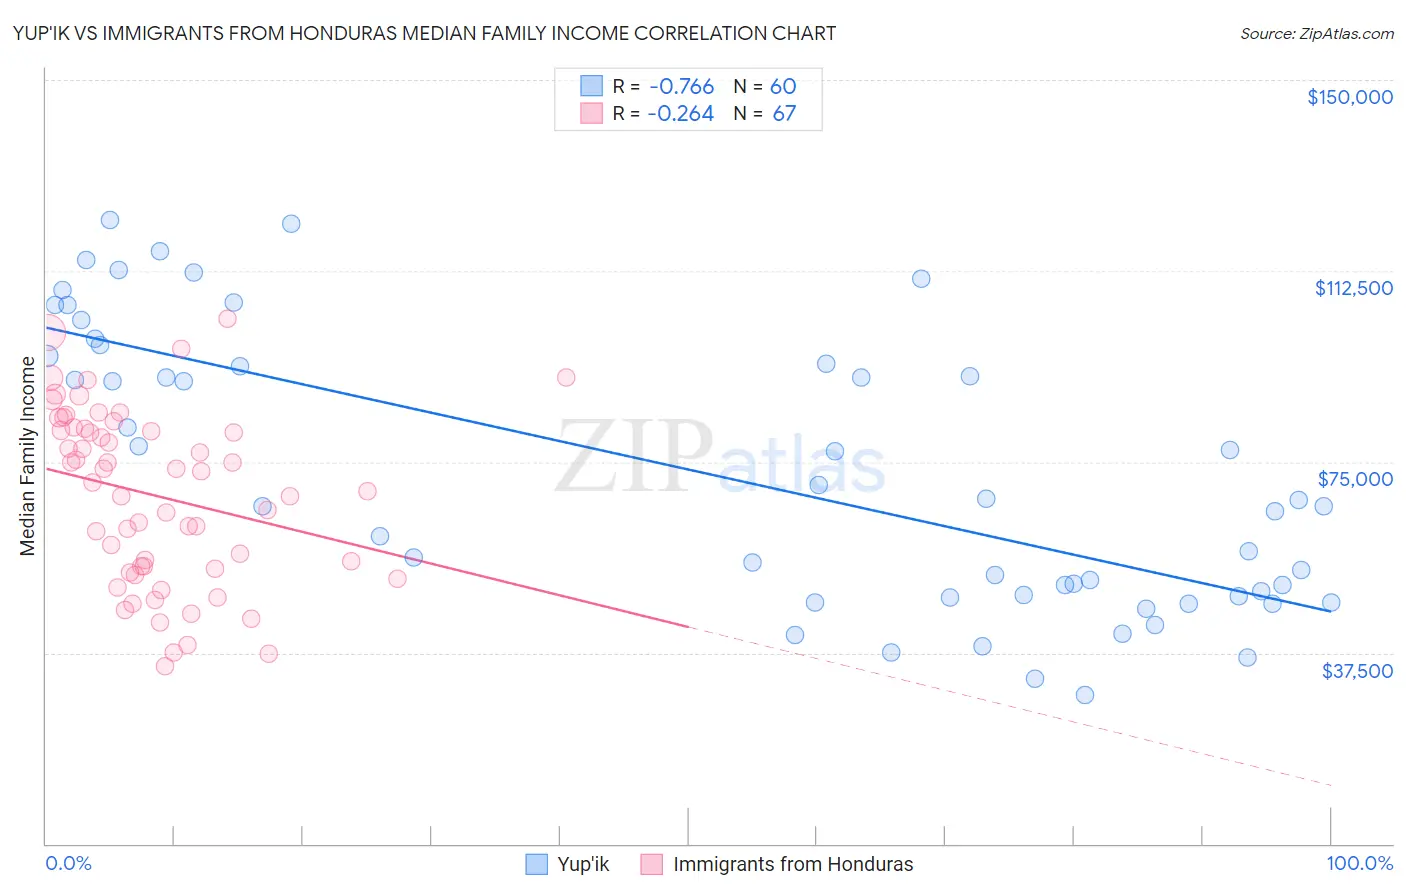
Yup'ik vs Immigrants from Honduras Median Family Income Correlation Chart
The statistical analysis conducted on geographies consisting of 39,952,310 people shows a strong negative correlation between the proportion of Yup'ik and median family income in the United States with a correlation coefficient (R) of -0.766 and weighted average of $79,290. Similarly, the statistical analysis conducted on geographies consisting of 322,401,068 people shows a weak negative correlation between the proportion of Immigrants from Honduras and median family income in the United States with a correlation coefficient (R) of -0.264 and weighted average of $83,618, a difference of 5.5%.
Median Family Income Correlation Summary
| Measurement | Yup'ik | Immigrants from Honduras |
| Minimum | $29,250 | $34,952 |
| Maximum | $122,399 | $103,059 |
| Range | $93,149 | $68,107 |
| Mean | $72,637 | $68,333 |
| Median | $66,875 | $70,983 |
| Interquartile 25% (IQ1) | $48,824 | $53,890 |
| Interquartile 75% (IQ3) | $95,045 | $81,453 |
| Interquartile Range (IQR) | $46,221 | $27,563 |
| Standard Deviation (Sample) | $27,024 | $17,040 |
| Standard Deviation (Population) | $26,798 | $16,912 |
Demographics Similar to Yup'ik and Immigrants from Honduras by Median Family Income
In terms of median family income, the demographic groups most similar to Yup'ik are Menominee ($79,563, a difference of 0.34%), Immigrants from Cuba ($78,249, a difference of 1.3%), Yuman ($78,055, a difference of 1.6%), Kiowa ($80,885, a difference of 2.0%), and Native/Alaskan ($80,908, a difference of 2.0%). Similarly, the demographic groups most similar to Immigrants from Honduras are Immigrants from Mexico ($83,639, a difference of 0.030%), Seminole ($83,354, a difference of 0.32%), Immigrants from Caribbean ($83,319, a difference of 0.36%), Yakama ($83,932, a difference of 0.38%), and Dominican ($82,888, a difference of 0.88%).
| Demographics | Rating | Rank | Median Family Income |
| Yakama | 0.0 /100 | #317 | Tragic $83,932 |
| Immigrants | Mexico | 0.0 /100 | #318 | Tragic $83,639 |
| Immigrants | Honduras | 0.0 /100 | #319 | Tragic $83,618 |
| Seminole | 0.0 /100 | #320 | Tragic $83,354 |
| Immigrants | Caribbean | 0.0 /100 | #321 | Tragic $83,319 |
| Dominicans | 0.0 /100 | #322 | Tragic $82,888 |
| Bahamians | 0.0 /100 | #323 | Tragic $82,631 |
| Creek | 0.0 /100 | #324 | Tragic $82,560 |
| Sioux | 0.0 /100 | #325 | Tragic $82,386 |
| Immigrants | Congo | 0.0 /100 | #326 | Tragic $82,216 |
| Arapaho | 0.0 /100 | #327 | Tragic $82,064 |
| Blacks/African Americans | 0.0 /100 | #328 | Tragic $81,912 |
| Dutch West Indians | 0.0 /100 | #329 | Tragic $81,852 |
| Cheyenne | 0.0 /100 | #330 | Tragic $81,385 |
| Immigrants | Dominican Republic | 0.0 /100 | #331 | Tragic $81,233 |
| Natives/Alaskans | 0.0 /100 | #332 | Tragic $80,908 |
| Kiowa | 0.0 /100 | #333 | Tragic $80,885 |
| Menominee | 0.0 /100 | #334 | Tragic $79,563 |
| Yup'ik | 0.0 /100 | #335 | Tragic $79,290 |
| Immigrants | Cuba | 0.0 /100 | #336 | Tragic $78,249 |
| Yuman | 0.0 /100 | #337 | Tragic $78,055 |