Yugoslavian vs Immigrants from Philippines Per Capita Income
COMPARE
Yugoslavian
Immigrants from Philippines
Per Capita Income
Per Capita Income Comparison
Yugoslavians
Immigrants from Philippines
$42,792
PER CAPITA INCOME
27.4/ 100
METRIC RATING
191st/ 347
METRIC RANK
$44,000
PER CAPITA INCOME
59.4/ 100
METRIC RATING
165th/ 347
METRIC RANK
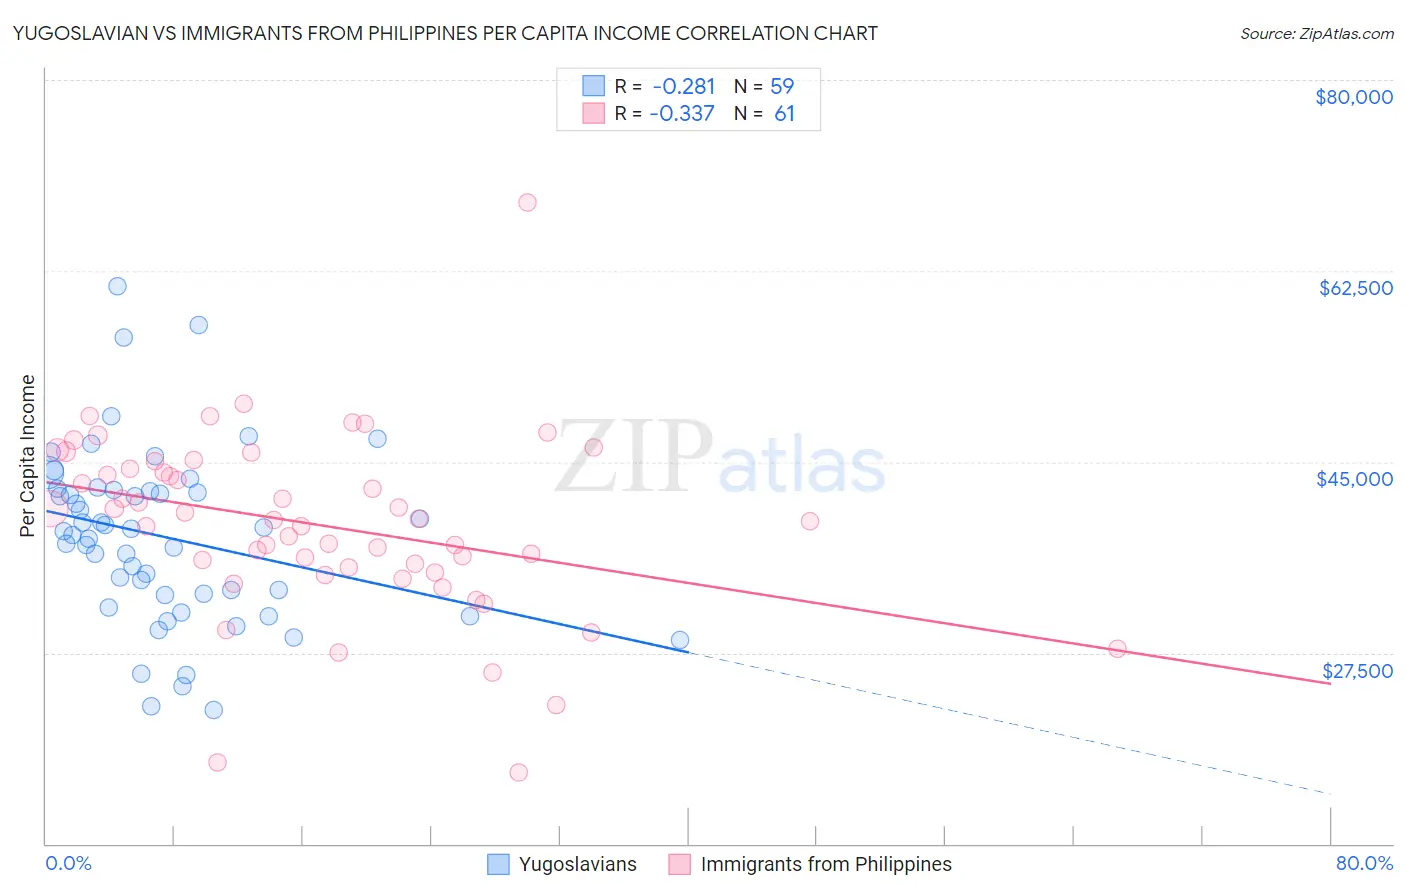
Yugoslavian vs Immigrants from Philippines Per Capita Income Correlation Chart
The statistical analysis conducted on geographies consisting of 285,729,855 people shows a weak negative correlation between the proportion of Yugoslavians and per capita income in the United States with a correlation coefficient (R) of -0.281 and weighted average of $42,792. Similarly, the statistical analysis conducted on geographies consisting of 471,310,372 people shows a mild negative correlation between the proportion of Immigrants from Philippines and per capita income in the United States with a correlation coefficient (R) of -0.337 and weighted average of $44,000, a difference of 2.8%.
Per Capita Income Correlation Summary
| Measurement | Yugoslavian | Immigrants from Philippines |
| Minimum | $22,217 | $16,552 |
| Maximum | $61,060 | $68,791 |
| Range | $38,843 | $52,239 |
| Mean | $38,123 | $39,238 |
| Median | $38,605 | $39,667 |
| Interquartile 25% (IQ1) | $32,828 | $35,101 |
| Interquartile 75% (IQ3) | $42,402 | $44,731 |
| Interquartile Range (IQR) | $9,574 | $9,631 |
| Standard Deviation (Sample) | $8,004 | $8,363 |
| Standard Deviation (Population) | $7,935 | $8,294 |
Similar Demographics by Per Capita Income
Demographics Similar to Yugoslavians by Per Capita Income
In terms of per capita income, the demographic groups most similar to Yugoslavians are Kenyan ($42,808, a difference of 0.040%), Iraqi ($42,760, a difference of 0.070%), Immigrants from Sierra Leone ($42,752, a difference of 0.090%), Immigrants from Fiji ($42,694, a difference of 0.23%), and Bermudan ($42,911, a difference of 0.28%).
| Demographics | Rating | Rank | Per Capita Income |
| Spaniards | 32.9 /100 | #184 | Fair $43,028 |
| Immigrants | Immigrants | 32.5 /100 | #185 | Fair $43,010 |
| French Canadians | 32.3 /100 | #186 | Fair $43,003 |
| Immigrants | Colombia | 31.5 /100 | #187 | Fair $42,971 |
| Immigrants | Africa | 31.0 /100 | #188 | Fair $42,950 |
| Bermudans | 30.1 /100 | #189 | Fair $42,911 |
| Kenyans | 27.7 /100 | #190 | Fair $42,808 |
| Yugoslavians | 27.4 /100 | #191 | Fair $42,792 |
| Iraqis | 26.7 /100 | #192 | Fair $42,760 |
| Immigrants | Sierra Leone | 26.5 /100 | #193 | Fair $42,752 |
| Immigrants | Fiji | 25.2 /100 | #194 | Fair $42,694 |
| Immigrants | Kenya | 24.5 /100 | #195 | Fair $42,661 |
| Dutch | 23.4 /100 | #196 | Fair $42,605 |
| Scotch-Irish | 22.6 /100 | #197 | Fair $42,563 |
| Immigrants | Portugal | 19.7 /100 | #198 | Poor $42,412 |
Demographics Similar to Immigrants from Philippines by Per Capita Income
In terms of per capita income, the demographic groups most similar to Immigrants from Philippines are Immigrants from Uruguay ($43,997, a difference of 0.010%), Sri Lankan ($44,014, a difference of 0.030%), English ($43,982, a difference of 0.040%), Belgian ($43,951, a difference of 0.11%), and Immigrants from South America ($44,068, a difference of 0.15%).
| Demographics | Rating | Rank | Per Capita Income |
| Immigrants | Nepal | 64.3 /100 | #158 | Good $44,187 |
| South Americans | 62.4 /100 | #159 | Good $44,114 |
| Danes | 61.9 /100 | #160 | Good $44,095 |
| Costa Ricans | 61.8 /100 | #161 | Good $44,090 |
| Swiss | 61.4 /100 | #162 | Good $44,076 |
| Immigrants | South America | 61.2 /100 | #163 | Good $44,068 |
| Sri Lankans | 59.8 /100 | #164 | Average $44,014 |
| Immigrants | Philippines | 59.4 /100 | #165 | Average $44,000 |
| Immigrants | Uruguay | 59.3 /100 | #166 | Average $43,997 |
| English | 58.9 /100 | #167 | Average $43,982 |
| Belgians | 58.1 /100 | #168 | Average $43,951 |
| Immigrants | Peru | 55.3 /100 | #169 | Average $43,852 |
| Scandinavians | 55.2 /100 | #170 | Average $43,848 |
| Immigrants | Eastern Africa | 54.9 /100 | #171 | Average $43,838 |
| Czechoslovakians | 54.1 /100 | #172 | Average $43,806 |