Yugoslavian vs Immigrants from Panama Per Capita Income
COMPARE
Yugoslavian
Immigrants from Panama
Per Capita Income
Per Capita Income Comparison
Yugoslavians
Immigrants from Panama
$42,792
PER CAPITA INCOME
27.4/ 100
METRIC RATING
191st/ 347
METRIC RANK
$41,853
PER CAPITA INCOME
11.6/ 100
METRIC RATING
211th/ 347
METRIC RANK
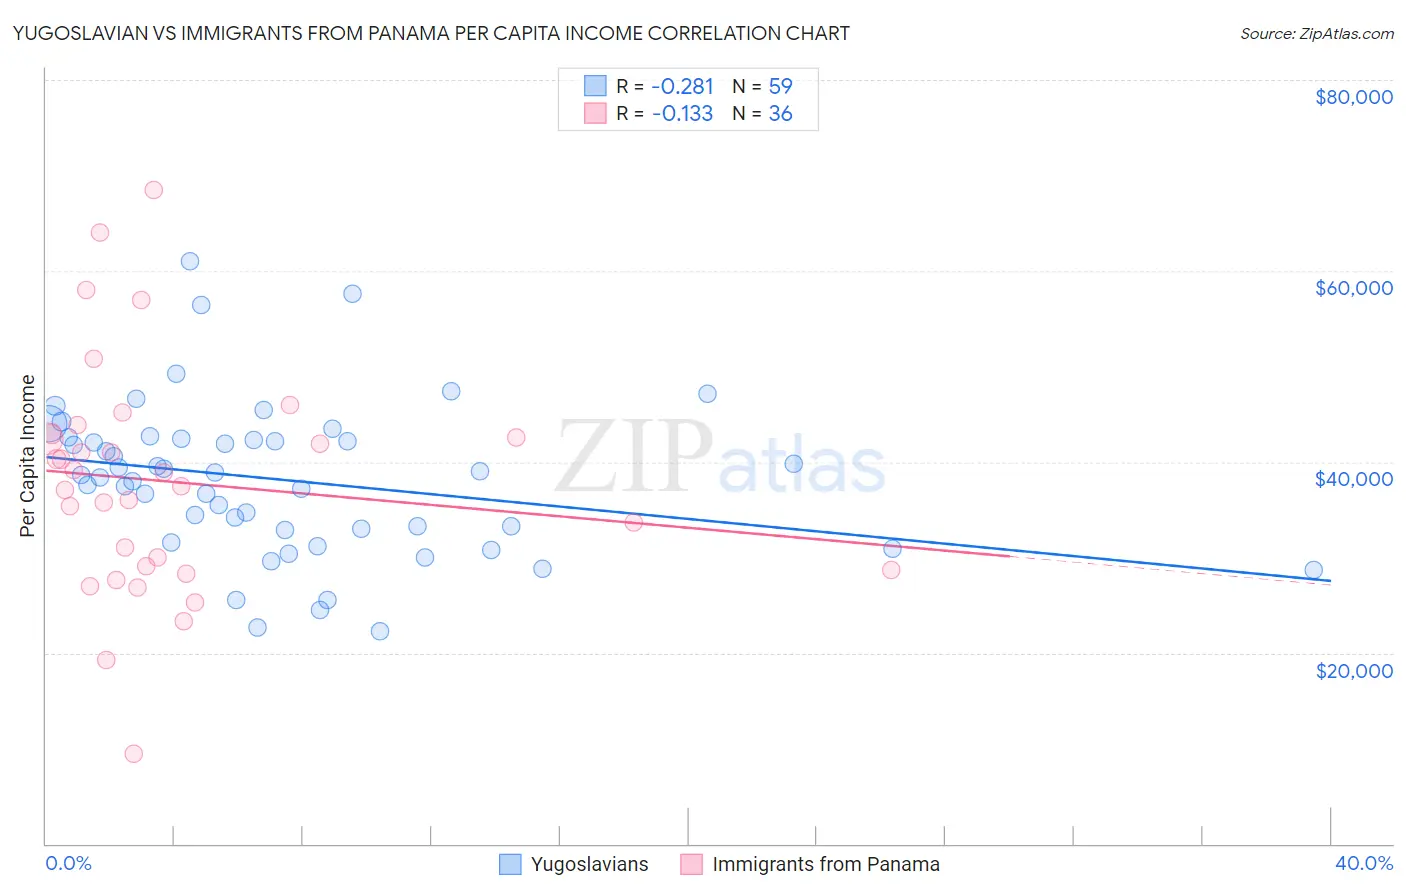
Yugoslavian vs Immigrants from Panama Per Capita Income Correlation Chart
The statistical analysis conducted on geographies consisting of 285,729,855 people shows a weak negative correlation between the proportion of Yugoslavians and per capita income in the United States with a correlation coefficient (R) of -0.281 and weighted average of $42,792. Similarly, the statistical analysis conducted on geographies consisting of 221,187,071 people shows a poor negative correlation between the proportion of Immigrants from Panama and per capita income in the United States with a correlation coefficient (R) of -0.133 and weighted average of $41,853, a difference of 2.2%.
Per Capita Income Correlation Summary
| Measurement | Yugoslavian | Immigrants from Panama |
| Minimum | $22,217 | $9,397 |
| Maximum | $61,060 | $68,465 |
| Range | $38,843 | $59,068 |
| Mean | $38,123 | $37,915 |
| Median | $38,605 | $38,159 |
| Interquartile 25% (IQ1) | $32,828 | $28,812 |
| Interquartile 75% (IQ3) | $42,402 | $42,786 |
| Interquartile Range (IQR) | $9,574 | $13,974 |
| Standard Deviation (Sample) | $8,004 | $12,078 |
| Standard Deviation (Population) | $7,935 | $11,909 |
Demographics Similar to Yugoslavians and Immigrants from Panama by Per Capita Income
In terms of per capita income, the demographic groups most similar to Yugoslavians are Iraqi ($42,760, a difference of 0.070%), Immigrants from Sierra Leone ($42,752, a difference of 0.090%), Immigrants from Fiji ($42,694, a difference of 0.23%), Immigrants from Kenya ($42,661, a difference of 0.31%), and Dutch ($42,605, a difference of 0.44%). Similarly, the demographic groups most similar to Immigrants from Panama are Ecuadorian ($41,958, a difference of 0.25%), Immigrants from Sudan ($41,986, a difference of 0.32%), Panamanian ($42,035, a difference of 0.43%), Venezuelan ($42,074, a difference of 0.53%), and Ghanaian ($42,164, a difference of 0.74%).
| Demographics | Rating | Rank | Per Capita Income |
| Yugoslavians | 27.4 /100 | #191 | Fair $42,792 |
| Iraqis | 26.7 /100 | #192 | Fair $42,760 |
| Immigrants | Sierra Leone | 26.5 /100 | #193 | Fair $42,752 |
| Immigrants | Fiji | 25.2 /100 | #194 | Fair $42,694 |
| Immigrants | Kenya | 24.5 /100 | #195 | Fair $42,661 |
| Dutch | 23.4 /100 | #196 | Fair $42,605 |
| Scotch-Irish | 22.6 /100 | #197 | Fair $42,563 |
| Immigrants | Portugal | 19.7 /100 | #198 | Poor $42,412 |
| Barbadians | 19.6 /100 | #199 | Poor $42,406 |
| Vietnamese | 19.0 /100 | #200 | Poor $42,368 |
| Immigrants | Thailand | 17.6 /100 | #201 | Poor $42,289 |
| Immigrants | Bosnia and Herzegovina | 17.5 /100 | #202 | Poor $42,278 |
| Spanish | 17.0 /100 | #203 | Poor $42,249 |
| Aleuts | 16.4 /100 | #204 | Poor $42,210 |
| Whites/Caucasians | 15.9 /100 | #205 | Poor $42,180 |
| Ghanaians | 15.7 /100 | #206 | Poor $42,164 |
| Venezuelans | 14.4 /100 | #207 | Poor $42,074 |
| Panamanians | 13.9 /100 | #208 | Poor $42,035 |
| Immigrants | Sudan | 13.2 /100 | #209 | Poor $41,986 |
| Ecuadorians | 12.9 /100 | #210 | Poor $41,958 |
| Immigrants | Panama | 11.6 /100 | #211 | Poor $41,853 |