Hmong vs Immigrants from Philippines Per Capita Income
COMPARE
Hmong
Immigrants from Philippines
Per Capita Income
Per Capita Income Comparison
Hmong
Immigrants from Philippines
$38,120
PER CAPITA INCOME
0.2/ 100
METRIC RATING
276th/ 347
METRIC RANK
$44,000
PER CAPITA INCOME
59.4/ 100
METRIC RATING
165th/ 347
METRIC RANK
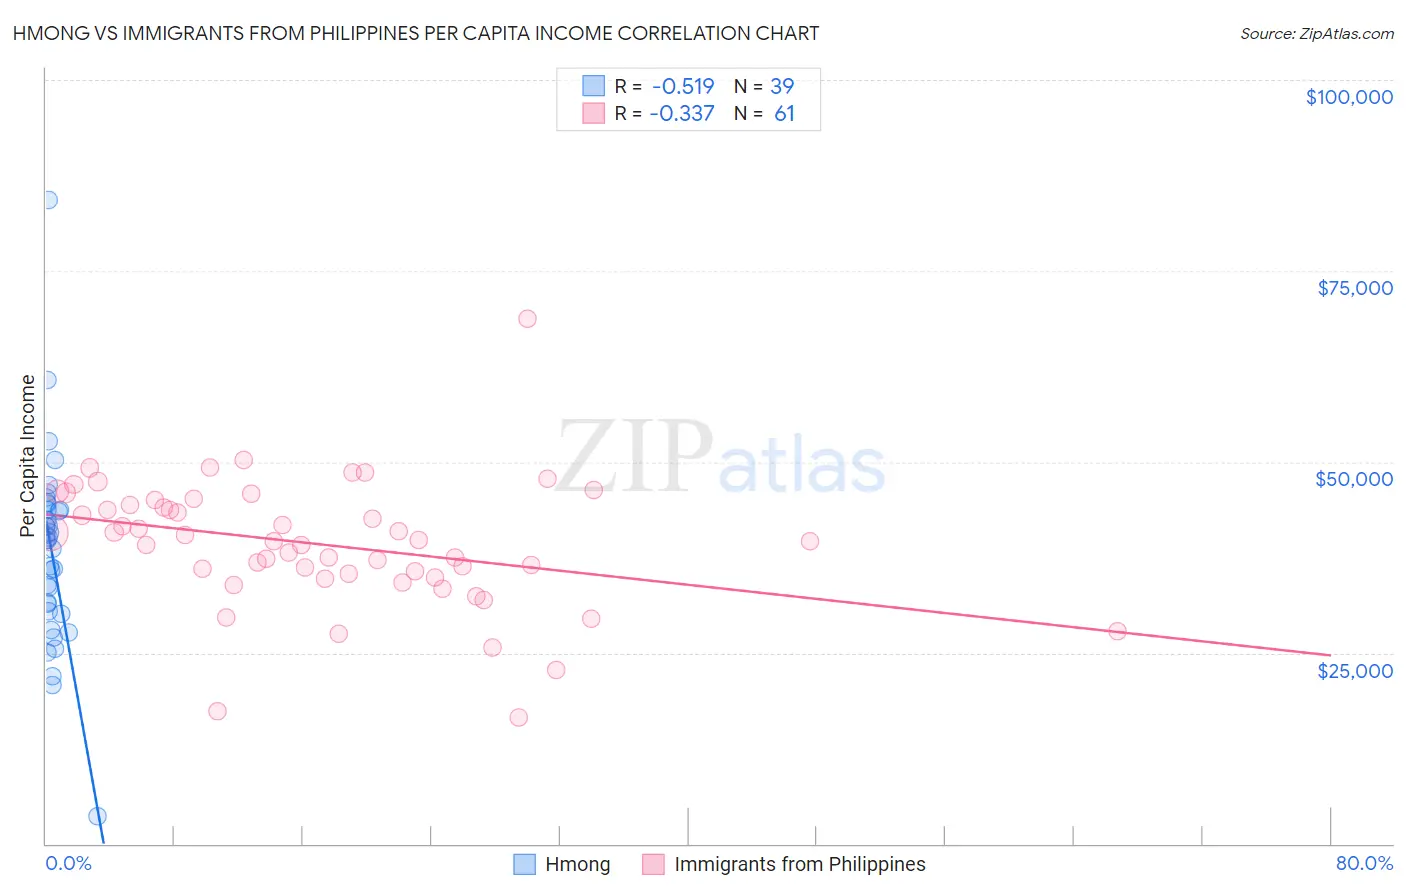
Hmong vs Immigrants from Philippines Per Capita Income Correlation Chart
The statistical analysis conducted on geographies consisting of 24,672,334 people shows a substantial negative correlation between the proportion of Hmong and per capita income in the United States with a correlation coefficient (R) of -0.519 and weighted average of $38,120. Similarly, the statistical analysis conducted on geographies consisting of 471,310,372 people shows a mild negative correlation between the proportion of Immigrants from Philippines and per capita income in the United States with a correlation coefficient (R) of -0.337 and weighted average of $44,000, a difference of 15.4%.
Per Capita Income Correlation Summary
| Measurement | Hmong | Immigrants from Philippines |
| Minimum | $3,563 | $16,552 |
| Maximum | $84,315 | $68,791 |
| Range | $80,752 | $52,239 |
| Mean | $38,244 | $39,238 |
| Median | $39,777 | $39,667 |
| Interquartile 25% (IQ1) | $30,464 | $35,101 |
| Interquartile 75% (IQ3) | $43,732 | $44,731 |
| Interquartile Range (IQR) | $13,268 | $9,631 |
| Standard Deviation (Sample) | $12,703 | $8,363 |
| Standard Deviation (Population) | $12,539 | $8,294 |
Similar Demographics by Per Capita Income
Demographics Similar to Hmong by Per Capita Income
In terms of per capita income, the demographic groups most similar to Hmong are Comanche ($38,088, a difference of 0.080%), Immigrants from Liberia ($38,165, a difference of 0.12%), Immigrants from Nicaragua ($38,065, a difference of 0.15%), Colville ($38,047, a difference of 0.19%), and Potawatomi ($38,046, a difference of 0.20%).
| Demographics | Rating | Rank | Per Capita Income |
| Immigrants | Jamaica | 0.4 /100 | #269 | Tragic $38,766 |
| Immigrants | Belize | 0.3 /100 | #270 | Tragic $38,614 |
| Central Americans | 0.3 /100 | #271 | Tragic $38,560 |
| Immigrants | Cabo Verde | 0.3 /100 | #272 | Tragic $38,540 |
| Nepalese | 0.3 /100 | #273 | Tragic $38,442 |
| Immigrants | El Salvador | 0.3 /100 | #274 | Tragic $38,394 |
| Immigrants | Liberia | 0.2 /100 | #275 | Tragic $38,165 |
| Hmong | 0.2 /100 | #276 | Tragic $38,120 |
| Comanche | 0.2 /100 | #277 | Tragic $38,088 |
| Immigrants | Nicaragua | 0.2 /100 | #278 | Tragic $38,065 |
| Colville | 0.2 /100 | #279 | Tragic $38,047 |
| Potawatomi | 0.2 /100 | #280 | Tragic $38,046 |
| Immigrants | Dominica | 0.2 /100 | #281 | Tragic $37,952 |
| Immigrants | Laos | 0.1 /100 | #282 | Tragic $37,857 |
| Pennsylvania Germans | 0.1 /100 | #283 | Tragic $37,842 |
Demographics Similar to Immigrants from Philippines by Per Capita Income
In terms of per capita income, the demographic groups most similar to Immigrants from Philippines are Immigrants from Uruguay ($43,997, a difference of 0.010%), Sri Lankan ($44,014, a difference of 0.030%), English ($43,982, a difference of 0.040%), Belgian ($43,951, a difference of 0.11%), and Immigrants from South America ($44,068, a difference of 0.15%).
| Demographics | Rating | Rank | Per Capita Income |
| Immigrants | Nepal | 64.3 /100 | #158 | Good $44,187 |
| South Americans | 62.4 /100 | #159 | Good $44,114 |
| Danes | 61.9 /100 | #160 | Good $44,095 |
| Costa Ricans | 61.8 /100 | #161 | Good $44,090 |
| Swiss | 61.4 /100 | #162 | Good $44,076 |
| Immigrants | South America | 61.2 /100 | #163 | Good $44,068 |
| Sri Lankans | 59.8 /100 | #164 | Average $44,014 |
| Immigrants | Philippines | 59.4 /100 | #165 | Average $44,000 |
| Immigrants | Uruguay | 59.3 /100 | #166 | Average $43,997 |
| English | 58.9 /100 | #167 | Average $43,982 |
| Belgians | 58.1 /100 | #168 | Average $43,951 |
| Immigrants | Peru | 55.3 /100 | #169 | Average $43,852 |
| Scandinavians | 55.2 /100 | #170 | Average $43,848 |
| Immigrants | Eastern Africa | 54.9 /100 | #171 | Average $43,838 |
| Czechoslovakians | 54.1 /100 | #172 | Average $43,806 |