Yugoslavian vs Cree Per Capita Income
COMPARE
Yugoslavian
Cree
Per Capita Income
Per Capita Income Comparison
Yugoslavians
Cree
$42,792
PER CAPITA INCOME
27.4/ 100
METRIC RATING
191st/ 347
METRIC RANK
$40,056
PER CAPITA INCOME
1.7/ 100
METRIC RATING
246th/ 347
METRIC RANK
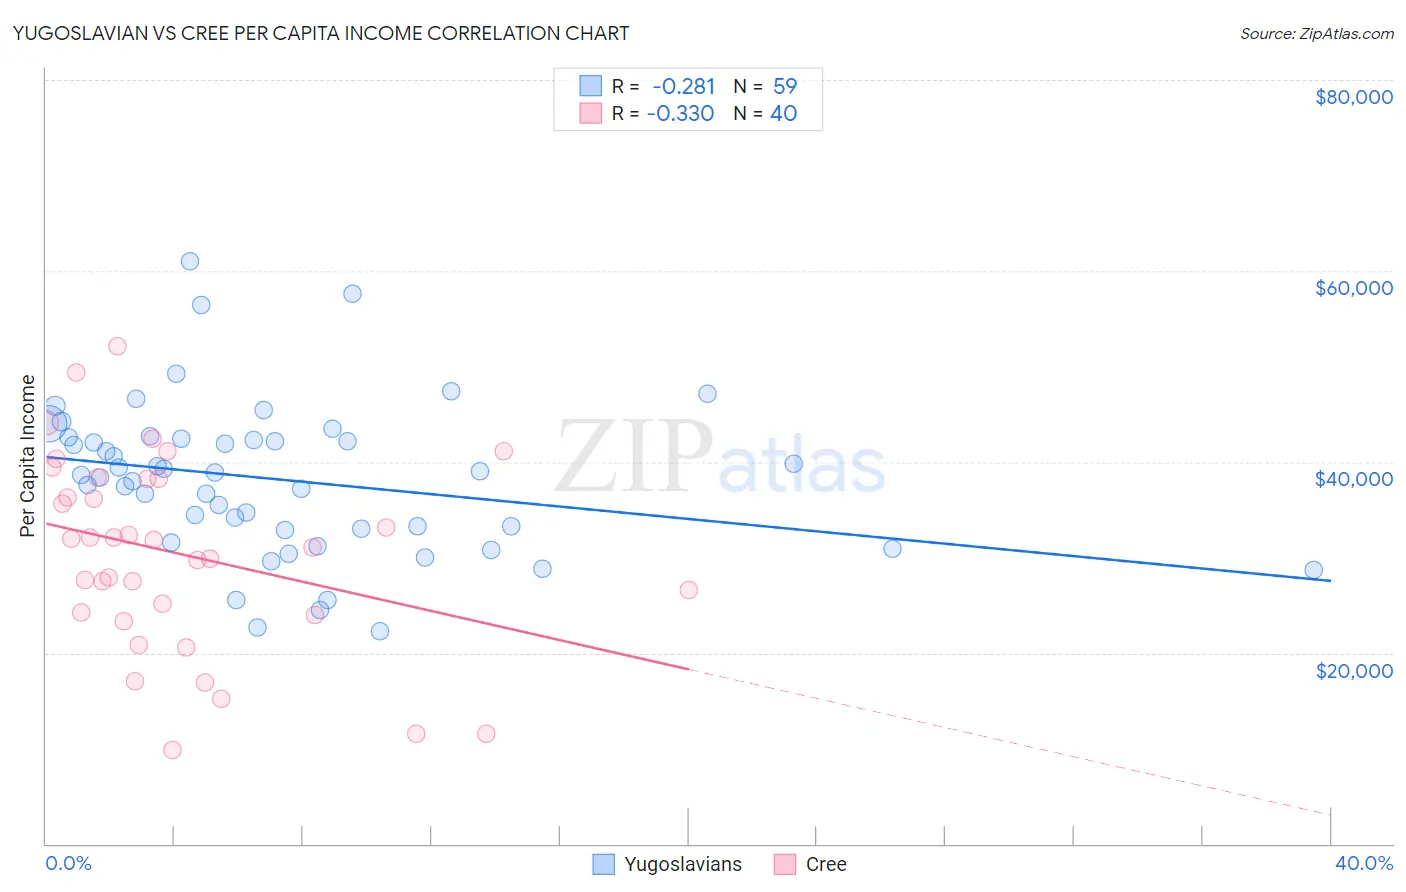
Yugoslavian vs Cree Per Capita Income Correlation Chart
The statistical analysis conducted on geographies consisting of 285,729,855 people shows a weak negative correlation between the proportion of Yugoslavians and per capita income in the United States with a correlation coefficient (R) of -0.281 and weighted average of $42,792. Similarly, the statistical analysis conducted on geographies consisting of 76,211,685 people shows a mild negative correlation between the proportion of Cree and per capita income in the United States with a correlation coefficient (R) of -0.330 and weighted average of $40,056, a difference of 6.8%.
Per Capita Income Correlation Summary
| Measurement | Yugoslavian | Cree |
| Minimum | $22,217 | $9,879 |
| Maximum | $61,060 | $52,079 |
| Range | $38,843 | $42,200 |
| Mean | $38,123 | $30,350 |
| Median | $38,605 | $31,398 |
| Interquartile 25% (IQ1) | $32,828 | $24,114 |
| Interquartile 75% (IQ3) | $42,402 | $38,235 |
| Interquartile Range (IQR) | $9,574 | $14,121 |
| Standard Deviation (Sample) | $8,004 | $10,115 |
| Standard Deviation (Population) | $7,935 | $9,988 |
Similar Demographics by Per Capita Income
Demographics Similar to Yugoslavians by Per Capita Income
In terms of per capita income, the demographic groups most similar to Yugoslavians are Kenyan ($42,808, a difference of 0.040%), Iraqi ($42,760, a difference of 0.070%), Immigrants from Sierra Leone ($42,752, a difference of 0.090%), Immigrants from Fiji ($42,694, a difference of 0.23%), and Bermudan ($42,911, a difference of 0.28%).
| Demographics | Rating | Rank | Per Capita Income |
| Spaniards | 32.9 /100 | #184 | Fair $43,028 |
| Immigrants | Immigrants | 32.5 /100 | #185 | Fair $43,010 |
| French Canadians | 32.3 /100 | #186 | Fair $43,003 |
| Immigrants | Colombia | 31.5 /100 | #187 | Fair $42,971 |
| Immigrants | Africa | 31.0 /100 | #188 | Fair $42,950 |
| Bermudans | 30.1 /100 | #189 | Fair $42,911 |
| Kenyans | 27.7 /100 | #190 | Fair $42,808 |
| Yugoslavians | 27.4 /100 | #191 | Fair $42,792 |
| Iraqis | 26.7 /100 | #192 | Fair $42,760 |
| Immigrants | Sierra Leone | 26.5 /100 | #193 | Fair $42,752 |
| Immigrants | Fiji | 25.2 /100 | #194 | Fair $42,694 |
| Immigrants | Kenya | 24.5 /100 | #195 | Fair $42,661 |
| Dutch | 23.4 /100 | #196 | Fair $42,605 |
| Scotch-Irish | 22.6 /100 | #197 | Fair $42,563 |
| Immigrants | Portugal | 19.7 /100 | #198 | Poor $42,412 |
Demographics Similar to Cree by Per Capita Income
In terms of per capita income, the demographic groups most similar to Cree are Immigrants from Somalia ($39,974, a difference of 0.20%), Subsaharan African ($40,152, a difference of 0.24%), Cape Verdean ($39,935, a difference of 0.30%), Japanese ($39,870, a difference of 0.46%), and French American Indian ($40,244, a difference of 0.47%).
| Demographics | Rating | Rank | Per Capita Income |
| Tsimshian | 2.4 /100 | #239 | Tragic $40,344 |
| Immigrants | Nigeria | 2.3 /100 | #240 | Tragic $40,339 |
| British West Indians | 2.3 /100 | #241 | Tragic $40,330 |
| Immigrants | Western Africa | 2.2 /100 | #242 | Tragic $40,294 |
| German Russians | 2.2 /100 | #243 | Tragic $40,266 |
| French American Indians | 2.1 /100 | #244 | Tragic $40,244 |
| Sub-Saharan Africans | 1.9 /100 | #245 | Tragic $40,152 |
| Cree | 1.7 /100 | #246 | Tragic $40,056 |
| Immigrants | Somalia | 1.6 /100 | #247 | Tragic $39,974 |
| Cape Verdeans | 1.5 /100 | #248 | Tragic $39,935 |
| Japanese | 1.4 /100 | #249 | Tragic $39,870 |
| Immigrants | Burma/Myanmar | 1.3 /100 | #250 | Tragic $39,827 |
| Samoans | 1.3 /100 | #251 | Tragic $39,826 |
| Immigrants | Azores | 1.0 /100 | #252 | Tragic $39,608 |
| Osage | 1.0 /100 | #253 | Tragic $39,568 |