Yugoslavian vs Maltese Per Capita Income
COMPARE
Yugoslavian
Maltese
Per Capita Income
Per Capita Income Comparison
Yugoslavians
Maltese
$42,792
PER CAPITA INCOME
27.4/ 100
METRIC RATING
191st/ 347
METRIC RANK
$49,640
PER CAPITA INCOME
99.9/ 100
METRIC RATING
63rd/ 347
METRIC RANK
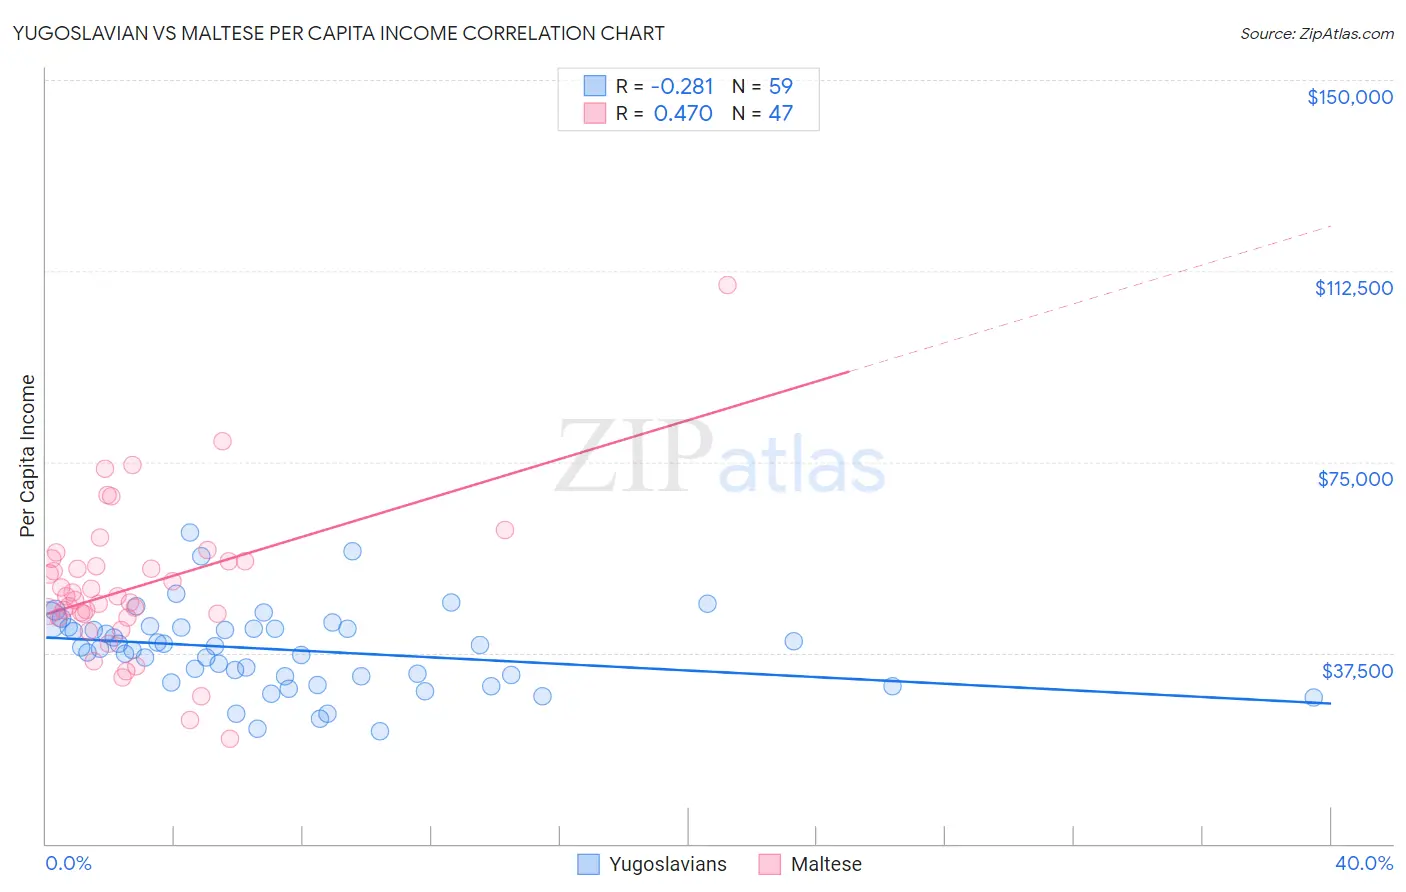
Yugoslavian vs Maltese Per Capita Income Correlation Chart
The statistical analysis conducted on geographies consisting of 285,729,855 people shows a weak negative correlation between the proportion of Yugoslavians and per capita income in the United States with a correlation coefficient (R) of -0.281 and weighted average of $42,792. Similarly, the statistical analysis conducted on geographies consisting of 126,316,532 people shows a moderate positive correlation between the proportion of Maltese and per capita income in the United States with a correlation coefficient (R) of 0.470 and weighted average of $49,640, a difference of 16.0%.
Per Capita Income Correlation Summary
| Measurement | Yugoslavian | Maltese |
| Minimum | $22,217 | $20,612 |
| Maximum | $61,060 | $109,686 |
| Range | $38,843 | $89,074 |
| Mean | $38,123 | $50,567 |
| Median | $38,605 | $48,495 |
| Interquartile 25% (IQ1) | $32,828 | $44,523 |
| Interquartile 75% (IQ3) | $42,402 | $55,569 |
| Interquartile Range (IQR) | $9,574 | $11,046 |
| Standard Deviation (Sample) | $8,004 | $14,877 |
| Standard Deviation (Population) | $7,935 | $14,718 |
Similar Demographics by Per Capita Income
Demographics Similar to Yugoslavians by Per Capita Income
In terms of per capita income, the demographic groups most similar to Yugoslavians are Kenyan ($42,808, a difference of 0.040%), Iraqi ($42,760, a difference of 0.070%), Immigrants from Sierra Leone ($42,752, a difference of 0.090%), Immigrants from Fiji ($42,694, a difference of 0.23%), and Bermudan ($42,911, a difference of 0.28%).
| Demographics | Rating | Rank | Per Capita Income |
| Spaniards | 32.9 /100 | #184 | Fair $43,028 |
| Immigrants | Immigrants | 32.5 /100 | #185 | Fair $43,010 |
| French Canadians | 32.3 /100 | #186 | Fair $43,003 |
| Immigrants | Colombia | 31.5 /100 | #187 | Fair $42,971 |
| Immigrants | Africa | 31.0 /100 | #188 | Fair $42,950 |
| Bermudans | 30.1 /100 | #189 | Fair $42,911 |
| Kenyans | 27.7 /100 | #190 | Fair $42,808 |
| Yugoslavians | 27.4 /100 | #191 | Fair $42,792 |
| Iraqis | 26.7 /100 | #192 | Fair $42,760 |
| Immigrants | Sierra Leone | 26.5 /100 | #193 | Fair $42,752 |
| Immigrants | Fiji | 25.2 /100 | #194 | Fair $42,694 |
| Immigrants | Kenya | 24.5 /100 | #195 | Fair $42,661 |
| Dutch | 23.4 /100 | #196 | Fair $42,605 |
| Scotch-Irish | 22.6 /100 | #197 | Fair $42,563 |
| Immigrants | Portugal | 19.7 /100 | #198 | Poor $42,412 |
Demographics Similar to Maltese by Per Capita Income
In terms of per capita income, the demographic groups most similar to Maltese are Immigrants from Argentina ($49,627, a difference of 0.030%), Immigrants from Asia ($49,741, a difference of 0.20%), Bolivian ($49,526, a difference of 0.23%), Immigrants from Bulgaria ($49,482, a difference of 0.32%), and Immigrants from Romania ($49,463, a difference of 0.36%).
| Demographics | Rating | Rank | Per Capita Income |
| Asians | 99.9 /100 | #56 | Exceptional $50,057 |
| South Africans | 99.9 /100 | #57 | Exceptional $50,044 |
| Immigrants | Malaysia | 99.9 /100 | #58 | Exceptional $49,983 |
| Bhutanese | 99.9 /100 | #59 | Exceptional $49,894 |
| Immigrants | Scotland | 99.9 /100 | #60 | Exceptional $49,893 |
| Argentineans | 99.9 /100 | #61 | Exceptional $49,862 |
| Immigrants | Asia | 99.9 /100 | #62 | Exceptional $49,741 |
| Maltese | 99.9 /100 | #63 | Exceptional $49,640 |
| Immigrants | Argentina | 99.9 /100 | #64 | Exceptional $49,627 |
| Bolivians | 99.9 /100 | #65 | Exceptional $49,526 |
| Immigrants | Bulgaria | 99.9 /100 | #66 | Exceptional $49,482 |
| Immigrants | Romania | 99.9 /100 | #67 | Exceptional $49,463 |
| Lithuanians | 99.8 /100 | #68 | Exceptional $49,448 |
| Immigrants | Canada | 99.8 /100 | #69 | Exceptional $49,412 |
| Immigrants | Eastern Europe | 99.8 /100 | #70 | Exceptional $49,316 |