Immigrants from Burma/Myanmar vs Immigrants from Philippines Per Capita Income
COMPARE
Immigrants from Burma/Myanmar
Immigrants from Philippines
Per Capita Income
Per Capita Income Comparison
Immigrants from Burma/Myanmar
Immigrants from Philippines
$39,827
PER CAPITA INCOME
1.3/ 100
METRIC RATING
250th/ 347
METRIC RANK
$44,000
PER CAPITA INCOME
59.4/ 100
METRIC RATING
165th/ 347
METRIC RANK
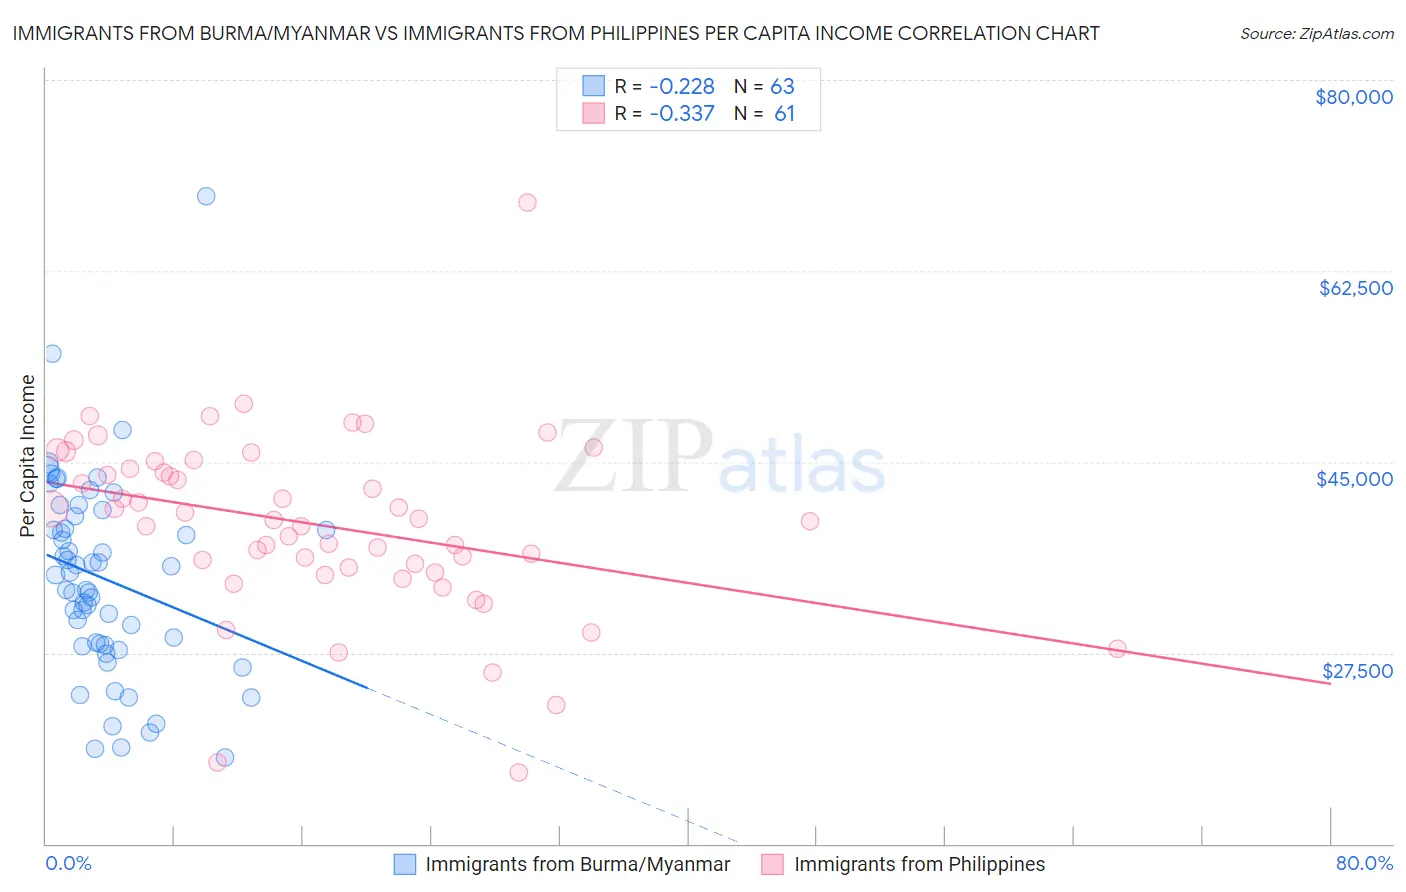
Immigrants from Burma/Myanmar vs Immigrants from Philippines Per Capita Income Correlation Chart
The statistical analysis conducted on geographies consisting of 172,363,704 people shows a weak negative correlation between the proportion of Immigrants from Burma/Myanmar and per capita income in the United States with a correlation coefficient (R) of -0.228 and weighted average of $39,827. Similarly, the statistical analysis conducted on geographies consisting of 471,310,372 people shows a mild negative correlation between the proportion of Immigrants from Philippines and per capita income in the United States with a correlation coefficient (R) of -0.337 and weighted average of $44,000, a difference of 10.5%.
Per Capita Income Correlation Summary
| Measurement | Immigrants from Burma/Myanmar | Immigrants from Philippines |
| Minimum | $17,897 | $16,552 |
| Maximum | $69,358 | $68,791 |
| Range | $51,461 | $52,239 |
| Mean | $34,299 | $39,238 |
| Median | $34,636 | $39,667 |
| Interquartile 25% (IQ1) | $28,210 | $35,101 |
| Interquartile 75% (IQ3) | $40,057 | $44,731 |
| Interquartile Range (IQR) | $11,847 | $9,631 |
| Standard Deviation (Sample) | $9,103 | $8,363 |
| Standard Deviation (Population) | $9,031 | $8,294 |
Similar Demographics by Per Capita Income
Demographics Similar to Immigrants from Burma/Myanmar by Per Capita Income
In terms of per capita income, the demographic groups most similar to Immigrants from Burma/Myanmar are Samoan ($39,826, a difference of 0.0%), Japanese ($39,870, a difference of 0.11%), Cape Verdean ($39,935, a difference of 0.27%), Immigrants from Somalia ($39,974, a difference of 0.37%), and Immigrants from the Azores ($39,608, a difference of 0.55%).
| Demographics | Rating | Rank | Per Capita Income |
| German Russians | 2.2 /100 | #243 | Tragic $40,266 |
| French American Indians | 2.1 /100 | #244 | Tragic $40,244 |
| Sub-Saharan Africans | 1.9 /100 | #245 | Tragic $40,152 |
| Cree | 1.7 /100 | #246 | Tragic $40,056 |
| Immigrants | Somalia | 1.6 /100 | #247 | Tragic $39,974 |
| Cape Verdeans | 1.5 /100 | #248 | Tragic $39,935 |
| Japanese | 1.4 /100 | #249 | Tragic $39,870 |
| Immigrants | Burma/Myanmar | 1.3 /100 | #250 | Tragic $39,827 |
| Samoans | 1.3 /100 | #251 | Tragic $39,826 |
| Immigrants | Azores | 1.0 /100 | #252 | Tragic $39,608 |
| Osage | 1.0 /100 | #253 | Tragic $39,568 |
| Alaska Natives | 1.0 /100 | #254 | Tragic $39,558 |
| Immigrants | Middle Africa | 1.0 /100 | #255 | Tragic $39,529 |
| Hawaiians | 0.8 /100 | #256 | Tragic $39,403 |
| Nicaraguans | 0.8 /100 | #257 | Tragic $39,372 |
Demographics Similar to Immigrants from Philippines by Per Capita Income
In terms of per capita income, the demographic groups most similar to Immigrants from Philippines are Immigrants from Uruguay ($43,997, a difference of 0.010%), Sri Lankan ($44,014, a difference of 0.030%), English ($43,982, a difference of 0.040%), Belgian ($43,951, a difference of 0.11%), and Immigrants from South America ($44,068, a difference of 0.15%).
| Demographics | Rating | Rank | Per Capita Income |
| Immigrants | Nepal | 64.3 /100 | #158 | Good $44,187 |
| South Americans | 62.4 /100 | #159 | Good $44,114 |
| Danes | 61.9 /100 | #160 | Good $44,095 |
| Costa Ricans | 61.8 /100 | #161 | Good $44,090 |
| Swiss | 61.4 /100 | #162 | Good $44,076 |
| Immigrants | South America | 61.2 /100 | #163 | Good $44,068 |
| Sri Lankans | 59.8 /100 | #164 | Average $44,014 |
| Immigrants | Philippines | 59.4 /100 | #165 | Average $44,000 |
| Immigrants | Uruguay | 59.3 /100 | #166 | Average $43,997 |
| English | 58.9 /100 | #167 | Average $43,982 |
| Belgians | 58.1 /100 | #168 | Average $43,951 |
| Immigrants | Peru | 55.3 /100 | #169 | Average $43,852 |
| Scandinavians | 55.2 /100 | #170 | Average $43,848 |
| Immigrants | Eastern Africa | 54.9 /100 | #171 | Average $43,838 |
| Czechoslovakians | 54.1 /100 | #172 | Average $43,806 |