Uruguayan vs Turkish Median Family Income
COMPARE
Uruguayan
Turkish
Median Family Income
Median Family Income Comparison
Uruguayans
Turks
$100,656
MEDIAN FAMILY INCOME
26.3/ 100
METRIC RATING
194th/ 347
METRIC RANK
$121,202
MEDIAN FAMILY INCOME
100.0/ 100
METRIC RATING
25th/ 347
METRIC RANK
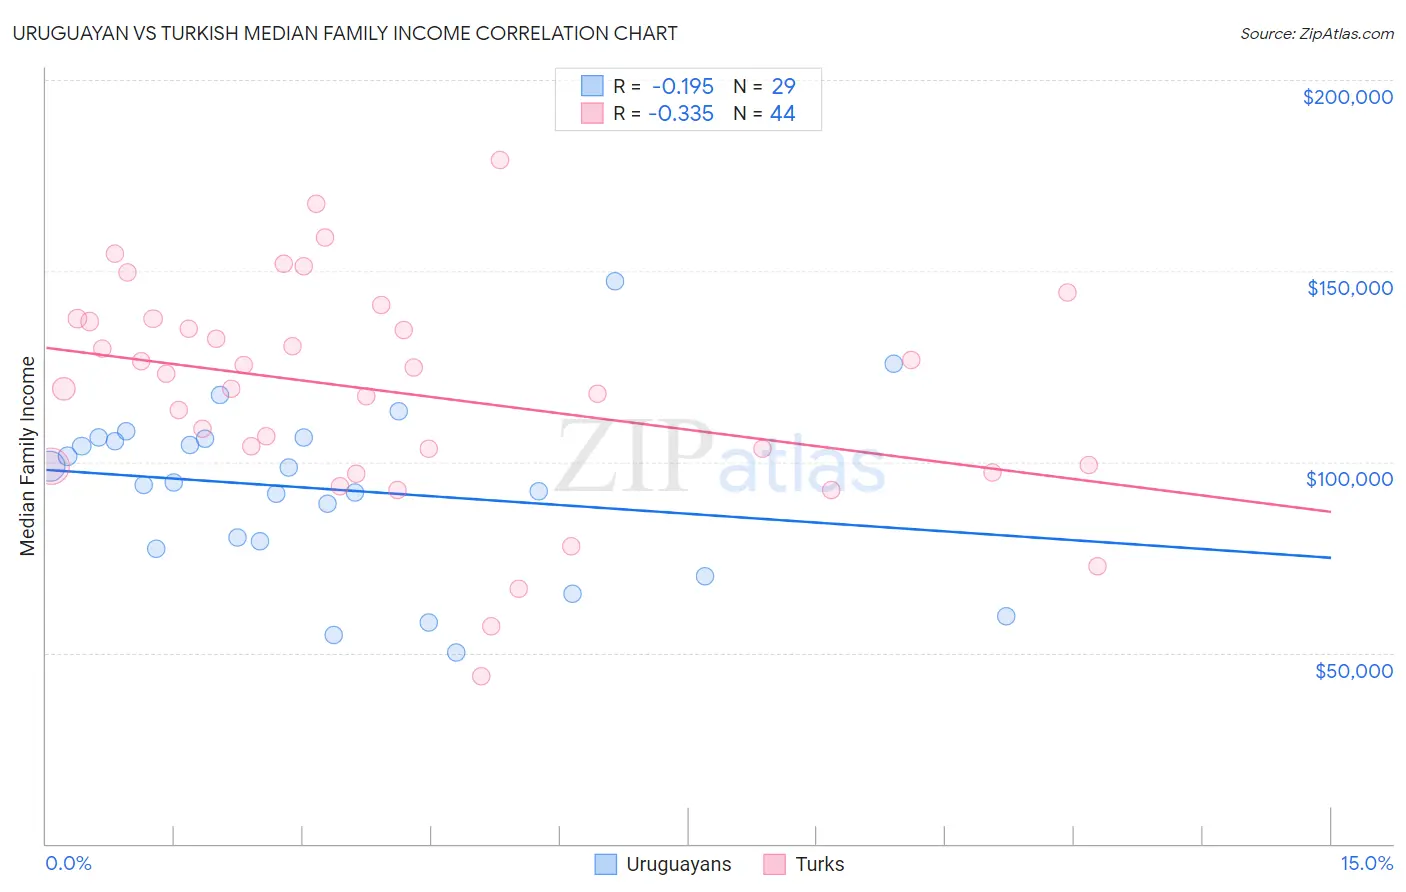
Uruguayan vs Turkish Median Family Income Correlation Chart
The statistical analysis conducted on geographies consisting of 144,757,564 people shows a poor negative correlation between the proportion of Uruguayans and median family income in the United States with a correlation coefficient (R) of -0.195 and weighted average of $100,656. Similarly, the statistical analysis conducted on geographies consisting of 271,625,572 people shows a mild negative correlation between the proportion of Turks and median family income in the United States with a correlation coefficient (R) of -0.335 and weighted average of $121,202, a difference of 20.4%.
Median Family Income Correlation Summary
| Measurement | Uruguayan | Turkish |
| Minimum | $50,000 | $43,750 |
| Maximum | $147,344 | $179,091 |
| Range | $97,344 | $135,341 |
| Mean | $92,799 | $118,204 |
| Median | $94,724 | $121,237 |
| Interquartile 25% (IQ1) | $78,231 | $99,051 |
| Interquartile 75% (IQ3) | $106,137 | $137,062 |
| Interquartile Range (IQR) | $27,906 | $38,011 |
| Standard Deviation (Sample) | $22,298 | $28,920 |
| Standard Deviation (Population) | $21,910 | $28,590 |
Similar Demographics by Median Family Income
Demographics Similar to Uruguayans by Median Family Income
In terms of median family income, the demographic groups most similar to Uruguayans are Iraqi ($100,658, a difference of 0.0%), Immigrants from Kenya ($100,679, a difference of 0.020%), Colombian ($100,750, a difference of 0.090%), Immigrants from South America ($100,414, a difference of 0.24%), and Immigrants ($100,962, a difference of 0.30%).
| Demographics | Rating | Rank | Median Family Income |
| Tlingit-Haida | 30.8 /100 | #187 | Fair $101,092 |
| Guamanians/Chamorros | 30.5 /100 | #188 | Fair $101,061 |
| Immigrants | Portugal | 29.6 /100 | #189 | Fair $100,984 |
| Immigrants | Immigrants | 29.4 /100 | #190 | Fair $100,962 |
| Colombians | 27.2 /100 | #191 | Fair $100,750 |
| Immigrants | Kenya | 26.5 /100 | #192 | Fair $100,679 |
| Iraqis | 26.3 /100 | #193 | Fair $100,658 |
| Uruguayans | 26.3 /100 | #194 | Fair $100,656 |
| Immigrants | South America | 23.9 /100 | #195 | Fair $100,414 |
| Samoans | 23.3 /100 | #196 | Fair $100,344 |
| Immigrants | Cameroon | 22.8 /100 | #197 | Fair $100,289 |
| Immigrants | Africa | 22.5 /100 | #198 | Fair $100,256 |
| Yugoslavians | 21.3 /100 | #199 | Fair $100,119 |
| Spanish | 20.1 /100 | #200 | Fair $99,977 |
| Immigrants | Thailand | 19.0 /100 | #201 | Poor $99,840 |
Demographics Similar to Turks by Median Family Income
In terms of median family income, the demographic groups most similar to Turks are Immigrants from Switzerland ($120,726, a difference of 0.39%), Immigrants from Northern Europe ($121,840, a difference of 0.53%), Russian ($120,487, a difference of 0.59%), Immigrants from Denmark ($120,445, a difference of 0.63%), and Latvian ($120,301, a difference of 0.75%).
| Demographics | Rating | Rank | Median Family Income |
| Immigrants | Eastern Asia | 100.0 /100 | #18 | Exceptional $125,150 |
| Immigrants | Belgium | 100.0 /100 | #19 | Exceptional $123,831 |
| Burmese | 100.0 /100 | #20 | Exceptional $123,369 |
| Immigrants | Korea | 100.0 /100 | #21 | Exceptional $122,800 |
| Immigrants | Sweden | 100.0 /100 | #22 | Exceptional $122,765 |
| Immigrants | Japan | 100.0 /100 | #23 | Exceptional $122,764 |
| Immigrants | Northern Europe | 100.0 /100 | #24 | Exceptional $121,840 |
| Turks | 100.0 /100 | #25 | Exceptional $121,202 |
| Immigrants | Switzerland | 100.0 /100 | #26 | Exceptional $120,726 |
| Russians | 100.0 /100 | #27 | Exceptional $120,487 |
| Immigrants | Denmark | 100.0 /100 | #28 | Exceptional $120,445 |
| Latvians | 100.0 /100 | #29 | Exceptional $120,301 |
| Immigrants | Sri Lanka | 100.0 /100 | #30 | Exceptional $120,263 |
| Immigrants | France | 100.0 /100 | #31 | Exceptional $120,076 |
| Asians | 100.0 /100 | #32 | Exceptional $119,955 |