Uruguayan vs Immigrants from Czechoslovakia Median Family Income
COMPARE
Uruguayan
Immigrants from Czechoslovakia
Median Family Income
Median Family Income Comparison
Uruguayans
Immigrants from Czechoslovakia
$100,656
MEDIAN FAMILY INCOME
26.3/ 100
METRIC RATING
194th/ 347
METRIC RANK
$116,165
MEDIAN FAMILY INCOME
99.9/ 100
METRIC RATING
50th/ 347
METRIC RANK
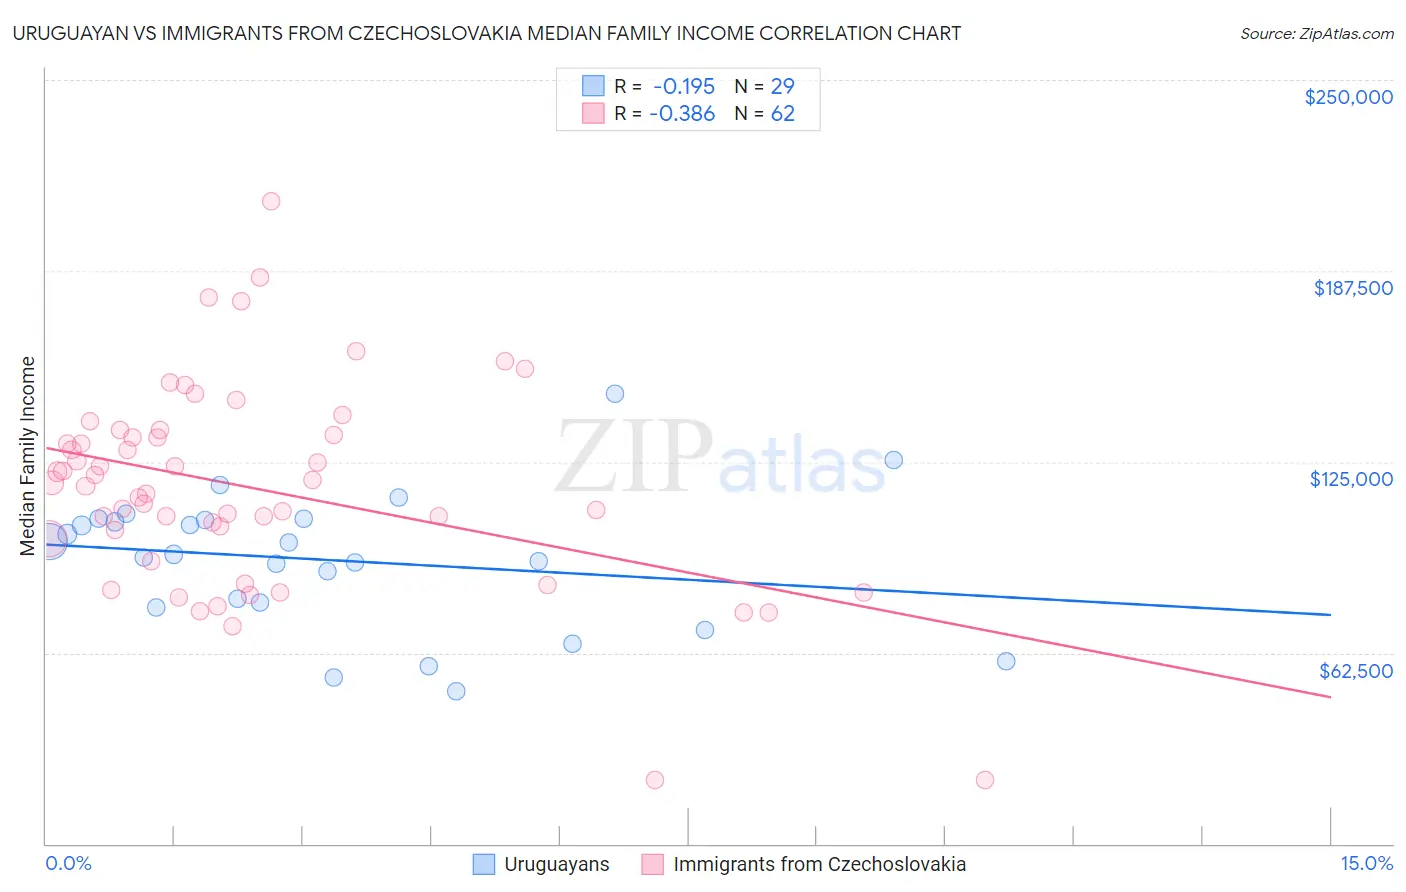
Uruguayan vs Immigrants from Czechoslovakia Median Family Income Correlation Chart
The statistical analysis conducted on geographies consisting of 144,757,564 people shows a poor negative correlation between the proportion of Uruguayans and median family income in the United States with a correlation coefficient (R) of -0.195 and weighted average of $100,656. Similarly, the statistical analysis conducted on geographies consisting of 195,434,997 people shows a mild negative correlation between the proportion of Immigrants from Czechoslovakia and median family income in the United States with a correlation coefficient (R) of -0.386 and weighted average of $116,165, a difference of 15.4%.
Median Family Income Correlation Summary
| Measurement | Uruguayan | Immigrants from Czechoslovakia |
| Minimum | $50,000 | $20,761 |
| Maximum | $147,344 | $210,139 |
| Range | $97,344 | $189,378 |
| Mean | $92,799 | $116,278 |
| Median | $94,724 | $117,481 |
| Interquartile 25% (IQ1) | $78,231 | $99,688 |
| Interquartile 75% (IQ3) | $106,137 | $133,750 |
| Interquartile Range (IQR) | $27,906 | $34,062 |
| Standard Deviation (Sample) | $22,298 | $34,098 |
| Standard Deviation (Population) | $21,910 | $33,822 |
Similar Demographics by Median Family Income
Demographics Similar to Uruguayans by Median Family Income
In terms of median family income, the demographic groups most similar to Uruguayans are Iraqi ($100,658, a difference of 0.0%), Immigrants from Kenya ($100,679, a difference of 0.020%), Colombian ($100,750, a difference of 0.090%), Immigrants from South America ($100,414, a difference of 0.24%), and Immigrants ($100,962, a difference of 0.30%).
| Demographics | Rating | Rank | Median Family Income |
| Tlingit-Haida | 30.8 /100 | #187 | Fair $101,092 |
| Guamanians/Chamorros | 30.5 /100 | #188 | Fair $101,061 |
| Immigrants | Portugal | 29.6 /100 | #189 | Fair $100,984 |
| Immigrants | Immigrants | 29.4 /100 | #190 | Fair $100,962 |
| Colombians | 27.2 /100 | #191 | Fair $100,750 |
| Immigrants | Kenya | 26.5 /100 | #192 | Fair $100,679 |
| Iraqis | 26.3 /100 | #193 | Fair $100,658 |
| Uruguayans | 26.3 /100 | #194 | Fair $100,656 |
| Immigrants | South America | 23.9 /100 | #195 | Fair $100,414 |
| Samoans | 23.3 /100 | #196 | Fair $100,344 |
| Immigrants | Cameroon | 22.8 /100 | #197 | Fair $100,289 |
| Immigrants | Africa | 22.5 /100 | #198 | Fair $100,256 |
| Yugoslavians | 21.3 /100 | #199 | Fair $100,119 |
| Spanish | 20.1 /100 | #200 | Fair $99,977 |
| Immigrants | Thailand | 19.0 /100 | #201 | Poor $99,840 |
Demographics Similar to Immigrants from Czechoslovakia by Median Family Income
In terms of median family income, the demographic groups most similar to Immigrants from Czechoslovakia are Chinese ($116,188, a difference of 0.020%), Immigrants from South Africa ($116,286, a difference of 0.10%), Immigrants from Malaysia ($115,880, a difference of 0.25%), Maltese ($115,862, a difference of 0.26%), and Immigrants from Norway ($115,847, a difference of 0.27%).
| Demographics | Rating | Rank | Median Family Income |
| Bulgarians | 100.0 /100 | #43 | Exceptional $117,818 |
| Cambodians | 100.0 /100 | #44 | Exceptional $117,780 |
| Immigrants | Greece | 99.9 /100 | #45 | Exceptional $117,344 |
| Immigrants | Russia | 99.9 /100 | #46 | Exceptional $116,942 |
| Immigrants | Austria | 99.9 /100 | #47 | Exceptional $116,830 |
| Immigrants | South Africa | 99.9 /100 | #48 | Exceptional $116,286 |
| Chinese | 99.9 /100 | #49 | Exceptional $116,188 |
| Immigrants | Czechoslovakia | 99.9 /100 | #50 | Exceptional $116,165 |
| Immigrants | Malaysia | 99.9 /100 | #51 | Exceptional $115,880 |
| Maltese | 99.9 /100 | #52 | Exceptional $115,862 |
| Immigrants | Norway | 99.9 /100 | #53 | Exceptional $115,847 |
| Immigrants | Europe | 99.9 /100 | #54 | Exceptional $115,523 |
| Lithuanians | 99.8 /100 | #55 | Exceptional $115,395 |
| New Zealanders | 99.8 /100 | #56 | Exceptional $115,230 |
| Greeks | 99.8 /100 | #57 | Exceptional $115,192 |