Uruguayan vs Immigrants from Kenya Median Family Income
COMPARE
Uruguayan
Immigrants from Kenya
Median Family Income
Median Family Income Comparison
Uruguayans
Immigrants from Kenya
$100,656
MEDIAN FAMILY INCOME
26.3/ 100
METRIC RATING
194th/ 347
METRIC RANK
$100,679
MEDIAN FAMILY INCOME
26.5/ 100
METRIC RATING
192nd/ 347
METRIC RANK
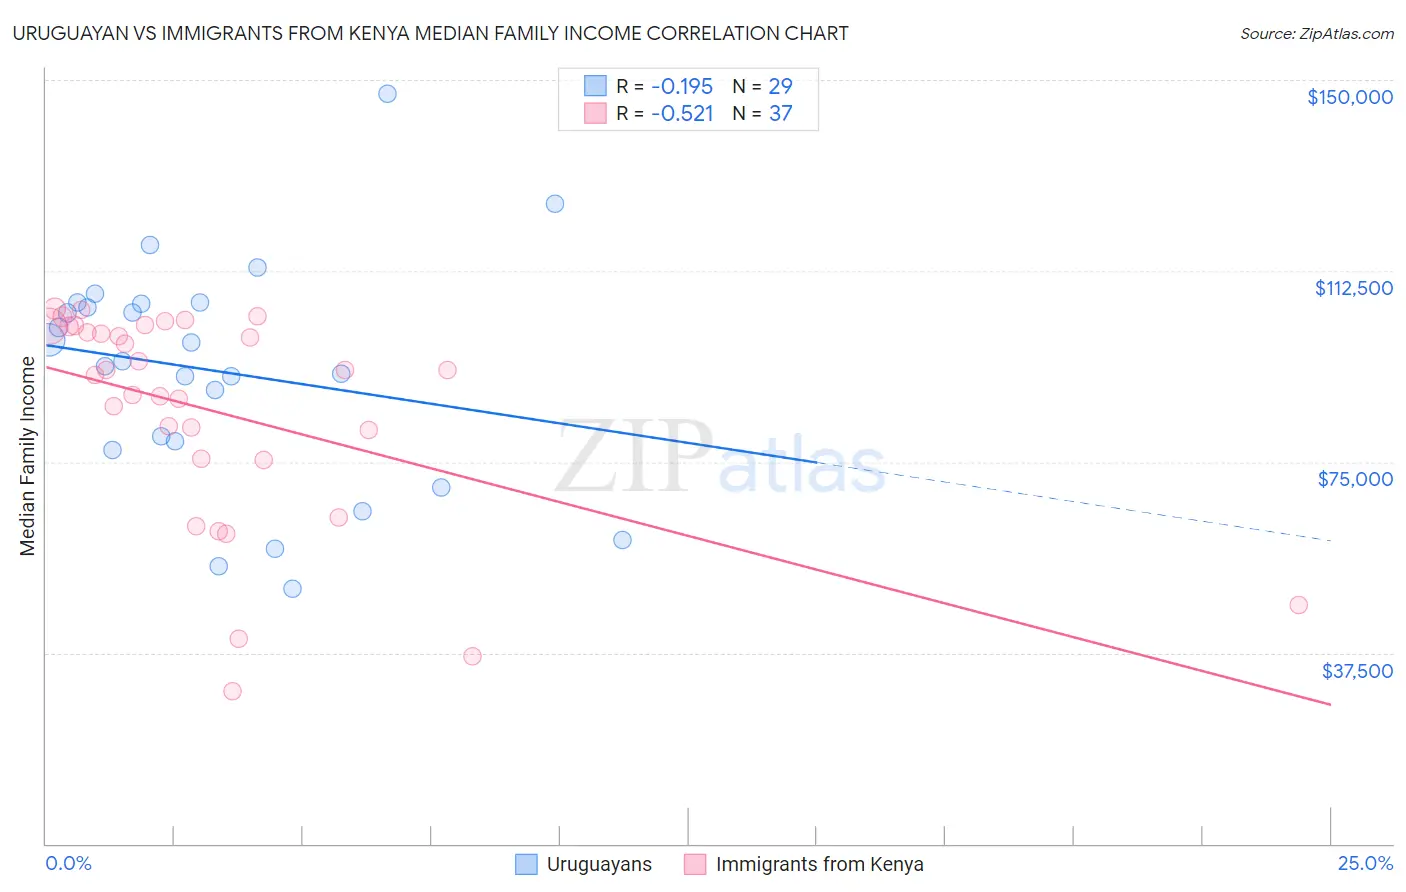
Uruguayan vs Immigrants from Kenya Median Family Income Correlation Chart
The statistical analysis conducted on geographies consisting of 144,757,564 people shows a poor negative correlation between the proportion of Uruguayans and median family income in the United States with a correlation coefficient (R) of -0.195 and weighted average of $100,656. Similarly, the statistical analysis conducted on geographies consisting of 217,962,146 people shows a substantial negative correlation between the proportion of Immigrants from Kenya and median family income in the United States with a correlation coefficient (R) of -0.521 and weighted average of $100,679, a difference of 0.020%.
Median Family Income Correlation Summary
| Measurement | Uruguayan | Immigrants from Kenya |
| Minimum | $50,000 | $29,978 |
| Maximum | $147,344 | $105,113 |
| Range | $97,344 | $75,135 |
| Mean | $92,799 | $84,908 |
| Median | $94,724 | $92,944 |
| Interquartile 25% (IQ1) | $78,231 | $75,494 |
| Interquartile 75% (IQ3) | $106,137 | $101,628 |
| Interquartile Range (IQR) | $27,906 | $26,135 |
| Standard Deviation (Sample) | $22,298 | $20,915 |
| Standard Deviation (Population) | $21,910 | $20,630 |
Demographics Similar to Uruguayans and Immigrants from Kenya by Median Family Income
In terms of median family income, the demographic groups most similar to Uruguayans are Iraqi ($100,658, a difference of 0.0%), Colombian ($100,750, a difference of 0.090%), Immigrants from South America ($100,414, a difference of 0.24%), Immigrants ($100,962, a difference of 0.30%), and Samoan ($100,344, a difference of 0.31%). Similarly, the demographic groups most similar to Immigrants from Kenya are Iraqi ($100,658, a difference of 0.020%), Colombian ($100,750, a difference of 0.070%), Immigrants from South America ($100,414, a difference of 0.26%), Immigrants ($100,962, a difference of 0.28%), and Immigrants from Portugal ($100,984, a difference of 0.30%).
| Demographics | Rating | Rank | Median Family Income |
| Kenyans | 34.5 /100 | #183 | Fair $101,417 |
| Immigrants | Costa Rica | 33.7 /100 | #184 | Fair $101,354 |
| Dutch | 31.9 /100 | #185 | Fair $101,192 |
| Celtics | 31.3 /100 | #186 | Fair $101,139 |
| Tlingit-Haida | 30.8 /100 | #187 | Fair $101,092 |
| Guamanians/Chamorros | 30.5 /100 | #188 | Fair $101,061 |
| Immigrants | Portugal | 29.6 /100 | #189 | Fair $100,984 |
| Immigrants | Immigrants | 29.4 /100 | #190 | Fair $100,962 |
| Colombians | 27.2 /100 | #191 | Fair $100,750 |
| Immigrants | Kenya | 26.5 /100 | #192 | Fair $100,679 |
| Iraqis | 26.3 /100 | #193 | Fair $100,658 |
| Uruguayans | 26.3 /100 | #194 | Fair $100,656 |
| Immigrants | South America | 23.9 /100 | #195 | Fair $100,414 |
| Samoans | 23.3 /100 | #196 | Fair $100,344 |
| Immigrants | Cameroon | 22.8 /100 | #197 | Fair $100,289 |
| Immigrants | Africa | 22.5 /100 | #198 | Fair $100,256 |
| Yugoslavians | 21.3 /100 | #199 | Fair $100,119 |
| Spanish | 20.1 /100 | #200 | Fair $99,977 |
| Immigrants | Thailand | 19.0 /100 | #201 | Poor $99,840 |
| Whites/Caucasians | 18.7 /100 | #202 | Poor $99,800 |
| Scotch-Irish | 17.1 /100 | #203 | Poor $99,591 |