Uruguayan vs South American Indian Median Family Income
COMPARE
Uruguayan
South American Indian
Median Family Income
Median Family Income Comparison
Uruguayans
South American Indians
$100,656
MEDIAN FAMILY INCOME
26.3/ 100
METRIC RATING
194th/ 347
METRIC RANK
$103,624
MEDIAN FAMILY INCOME
61.9/ 100
METRIC RATING
167th/ 347
METRIC RANK
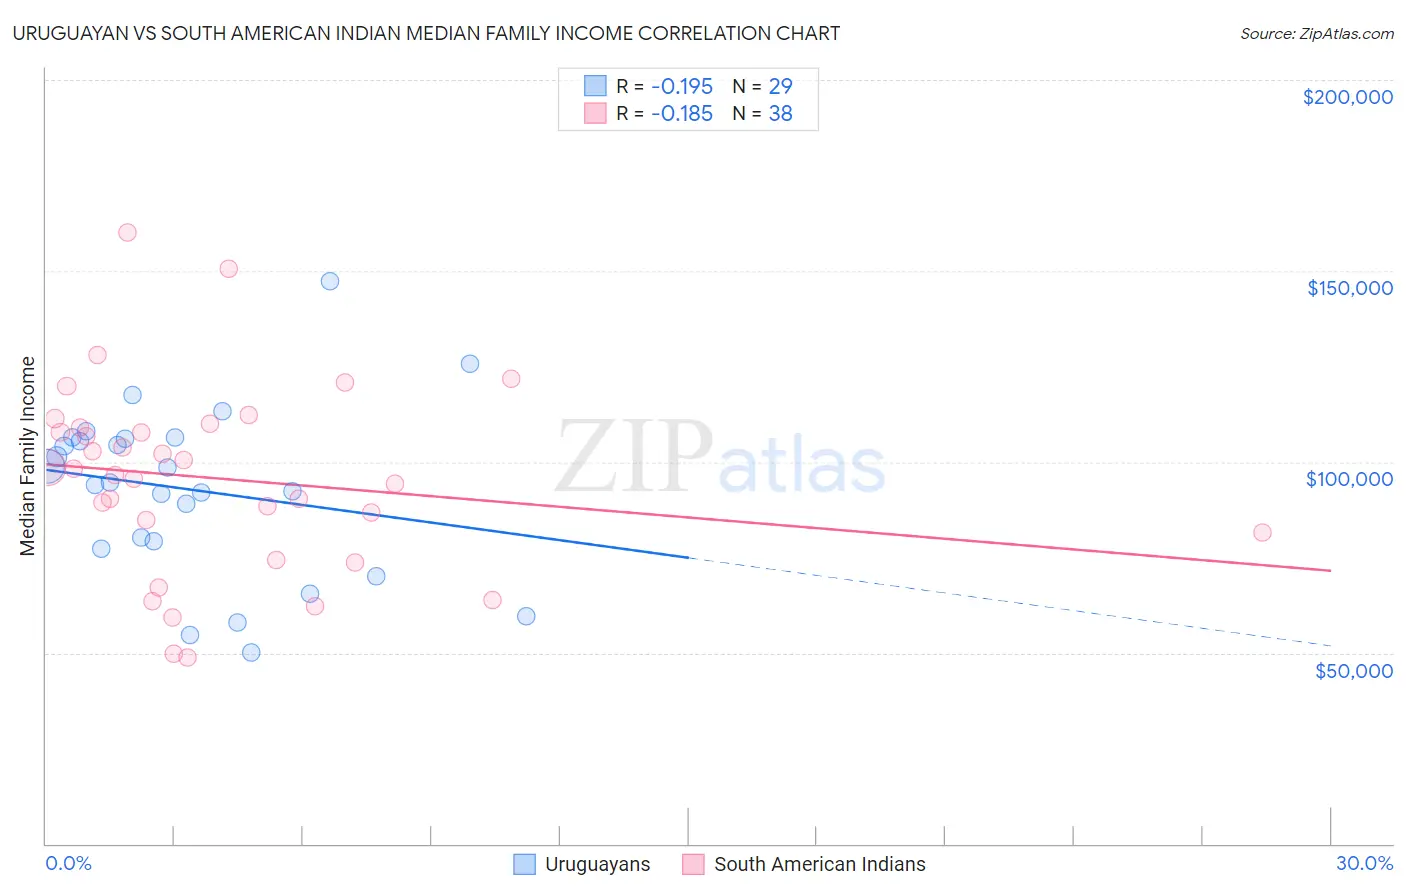
Uruguayan vs South American Indian Median Family Income Correlation Chart
The statistical analysis conducted on geographies consisting of 144,757,564 people shows a poor negative correlation between the proportion of Uruguayans and median family income in the United States with a correlation coefficient (R) of -0.195 and weighted average of $100,656. Similarly, the statistical analysis conducted on geographies consisting of 164,518,515 people shows a poor negative correlation between the proportion of South American Indians and median family income in the United States with a correlation coefficient (R) of -0.185 and weighted average of $103,624, a difference of 2.9%.
Median Family Income Correlation Summary
| Measurement | Uruguayan | South American Indian |
| Minimum | $50,000 | $48,893 |
| Maximum | $147,344 | $160,228 |
| Range | $97,344 | $111,335 |
| Mean | $92,799 | $95,594 |
| Median | $94,724 | $97,421 |
| Interquartile 25% (IQ1) | $78,231 | $81,563 |
| Interquartile 75% (IQ3) | $106,137 | $109,158 |
| Interquartile Range (IQR) | $27,906 | $27,595 |
| Standard Deviation (Sample) | $22,298 | $24,795 |
| Standard Deviation (Population) | $21,910 | $24,467 |
Similar Demographics by Median Family Income
Demographics Similar to Uruguayans by Median Family Income
In terms of median family income, the demographic groups most similar to Uruguayans are Iraqi ($100,658, a difference of 0.0%), Immigrants from Kenya ($100,679, a difference of 0.020%), Colombian ($100,750, a difference of 0.090%), Immigrants from South America ($100,414, a difference of 0.24%), and Immigrants ($100,962, a difference of 0.30%).
| Demographics | Rating | Rank | Median Family Income |
| Tlingit-Haida | 30.8 /100 | #187 | Fair $101,092 |
| Guamanians/Chamorros | 30.5 /100 | #188 | Fair $101,061 |
| Immigrants | Portugal | 29.6 /100 | #189 | Fair $100,984 |
| Immigrants | Immigrants | 29.4 /100 | #190 | Fair $100,962 |
| Colombians | 27.2 /100 | #191 | Fair $100,750 |
| Immigrants | Kenya | 26.5 /100 | #192 | Fair $100,679 |
| Iraqis | 26.3 /100 | #193 | Fair $100,658 |
| Uruguayans | 26.3 /100 | #194 | Fair $100,656 |
| Immigrants | South America | 23.9 /100 | #195 | Fair $100,414 |
| Samoans | 23.3 /100 | #196 | Fair $100,344 |
| Immigrants | Cameroon | 22.8 /100 | #197 | Fair $100,289 |
| Immigrants | Africa | 22.5 /100 | #198 | Fair $100,256 |
| Yugoslavians | 21.3 /100 | #199 | Fair $100,119 |
| Spanish | 20.1 /100 | #200 | Fair $99,977 |
| Immigrants | Thailand | 19.0 /100 | #201 | Poor $99,840 |
Demographics Similar to South American Indians by Median Family Income
In terms of median family income, the demographic groups most similar to South American Indians are English ($103,684, a difference of 0.060%), Immigrants from Peru ($103,534, a difference of 0.090%), Slovak ($103,729, a difference of 0.10%), Sierra Leonean ($103,859, a difference of 0.23%), and Czechoslovakian ($103,273, a difference of 0.34%).
| Demographics | Rating | Rank | Median Family Income |
| Scottish | 69.5 /100 | #160 | Good $104,288 |
| Icelanders | 69.4 /100 | #161 | Good $104,282 |
| Immigrants | Sierra Leone | 66.2 /100 | #162 | Good $103,990 |
| Costa Ricans | 66.2 /100 | #163 | Good $103,989 |
| Sierra Leoneans | 64.7 /100 | #164 | Good $103,859 |
| Slovaks | 63.1 /100 | #165 | Good $103,729 |
| English | 62.6 /100 | #166 | Good $103,684 |
| South American Indians | 61.9 /100 | #167 | Good $103,624 |
| Immigrants | Peru | 60.8 /100 | #168 | Good $103,534 |
| Czechoslovakians | 57.6 /100 | #169 | Average $103,273 |
| Immigrants | Uzbekistan | 56.6 /100 | #170 | Average $103,197 |
| Alsatians | 54.3 /100 | #171 | Average $103,010 |
| Immigrants | Eritrea | 51.9 /100 | #172 | Average $102,823 |
| Belgians | 51.4 /100 | #173 | Average $102,788 |
| Finns | 50.0 /100 | #174 | Average $102,676 |