Uruguayan vs Latvian Median Family Income
COMPARE
Uruguayan
Latvian
Median Family Income
Median Family Income Comparison
Uruguayans
Latvians
$100,656
MEDIAN FAMILY INCOME
26.3/ 100
METRIC RATING
194th/ 347
METRIC RANK
$120,301
MEDIAN FAMILY INCOME
100.0/ 100
METRIC RATING
29th/ 347
METRIC RANK
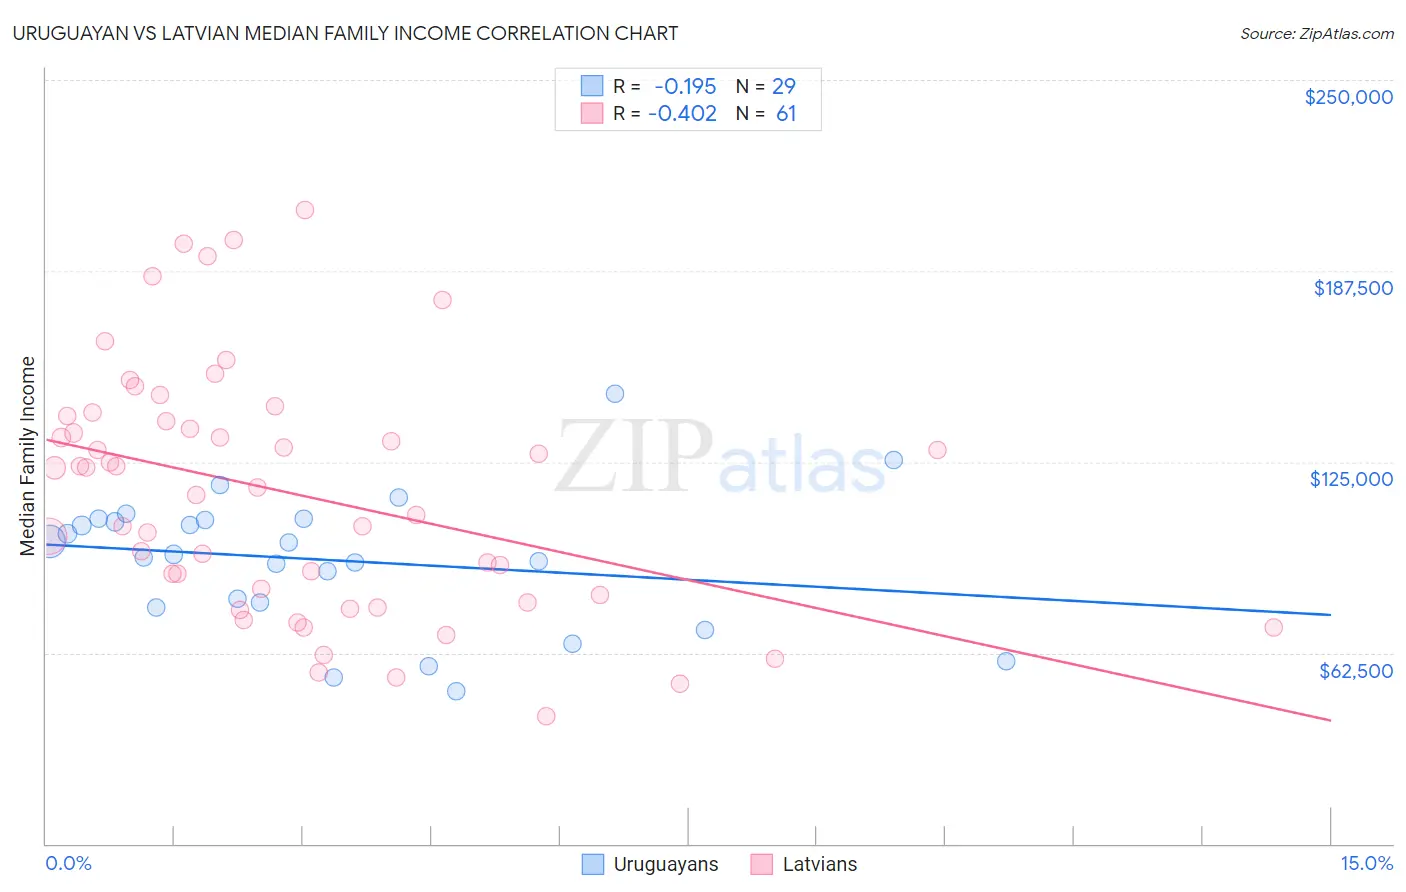
Uruguayan vs Latvian Median Family Income Correlation Chart
The statistical analysis conducted on geographies consisting of 144,757,564 people shows a poor negative correlation between the proportion of Uruguayans and median family income in the United States with a correlation coefficient (R) of -0.195 and weighted average of $100,656. Similarly, the statistical analysis conducted on geographies consisting of 220,626,536 people shows a moderate negative correlation between the proportion of Latvians and median family income in the United States with a correlation coefficient (R) of -0.402 and weighted average of $120,301, a difference of 19.5%.
Median Family Income Correlation Summary
| Measurement | Uruguayan | Latvian |
| Minimum | $50,000 | $41,641 |
| Maximum | $147,344 | $207,328 |
| Range | $97,344 | $165,687 |
| Mean | $92,799 | $114,631 |
| Median | $94,724 | $116,635 |
| Interquartile 25% (IQ1) | $78,231 | $80,254 |
| Interquartile 75% (IQ3) | $106,137 | $139,118 |
| Interquartile Range (IQR) | $27,906 | $58,864 |
| Standard Deviation (Sample) | $22,298 | $40,043 |
| Standard Deviation (Population) | $21,910 | $39,714 |
Similar Demographics by Median Family Income
Demographics Similar to Uruguayans by Median Family Income
In terms of median family income, the demographic groups most similar to Uruguayans are Iraqi ($100,658, a difference of 0.0%), Immigrants from Kenya ($100,679, a difference of 0.020%), Colombian ($100,750, a difference of 0.090%), Immigrants from South America ($100,414, a difference of 0.24%), and Immigrants ($100,962, a difference of 0.30%).
| Demographics | Rating | Rank | Median Family Income |
| Tlingit-Haida | 30.8 /100 | #187 | Fair $101,092 |
| Guamanians/Chamorros | 30.5 /100 | #188 | Fair $101,061 |
| Immigrants | Portugal | 29.6 /100 | #189 | Fair $100,984 |
| Immigrants | Immigrants | 29.4 /100 | #190 | Fair $100,962 |
| Colombians | 27.2 /100 | #191 | Fair $100,750 |
| Immigrants | Kenya | 26.5 /100 | #192 | Fair $100,679 |
| Iraqis | 26.3 /100 | #193 | Fair $100,658 |
| Uruguayans | 26.3 /100 | #194 | Fair $100,656 |
| Immigrants | South America | 23.9 /100 | #195 | Fair $100,414 |
| Samoans | 23.3 /100 | #196 | Fair $100,344 |
| Immigrants | Cameroon | 22.8 /100 | #197 | Fair $100,289 |
| Immigrants | Africa | 22.5 /100 | #198 | Fair $100,256 |
| Yugoslavians | 21.3 /100 | #199 | Fair $100,119 |
| Spanish | 20.1 /100 | #200 | Fair $99,977 |
| Immigrants | Thailand | 19.0 /100 | #201 | Poor $99,840 |
Demographics Similar to Latvians by Median Family Income
In terms of median family income, the demographic groups most similar to Latvians are Immigrants from Sri Lanka ($120,263, a difference of 0.030%), Immigrants from Denmark ($120,445, a difference of 0.12%), Russian ($120,487, a difference of 0.15%), Immigrants from France ($120,076, a difference of 0.19%), and Asian ($119,955, a difference of 0.29%).
| Demographics | Rating | Rank | Median Family Income |
| Immigrants | Sweden | 100.0 /100 | #22 | Exceptional $122,765 |
| Immigrants | Japan | 100.0 /100 | #23 | Exceptional $122,764 |
| Immigrants | Northern Europe | 100.0 /100 | #24 | Exceptional $121,840 |
| Turks | 100.0 /100 | #25 | Exceptional $121,202 |
| Immigrants | Switzerland | 100.0 /100 | #26 | Exceptional $120,726 |
| Russians | 100.0 /100 | #27 | Exceptional $120,487 |
| Immigrants | Denmark | 100.0 /100 | #28 | Exceptional $120,445 |
| Latvians | 100.0 /100 | #29 | Exceptional $120,301 |
| Immigrants | Sri Lanka | 100.0 /100 | #30 | Exceptional $120,263 |
| Immigrants | France | 100.0 /100 | #31 | Exceptional $120,076 |
| Asians | 100.0 /100 | #32 | Exceptional $119,955 |
| Bhutanese | 100.0 /100 | #33 | Exceptional $119,800 |
| Bolivians | 100.0 /100 | #34 | Exceptional $119,479 |
| Soviet Union | 100.0 /100 | #35 | Exceptional $119,262 |
| Israelis | 100.0 /100 | #36 | Exceptional $118,577 |