Uruguayan vs Immigrants from Lithuania Median Family Income
COMPARE
Uruguayan
Immigrants from Lithuania
Median Family Income
Median Family Income Comparison
Uruguayans
Immigrants from Lithuania
$100,656
MEDIAN FAMILY INCOME
26.3/ 100
METRIC RATING
194th/ 347
METRIC RANK
$118,053
MEDIAN FAMILY INCOME
100.0/ 100
METRIC RATING
40th/ 347
METRIC RANK
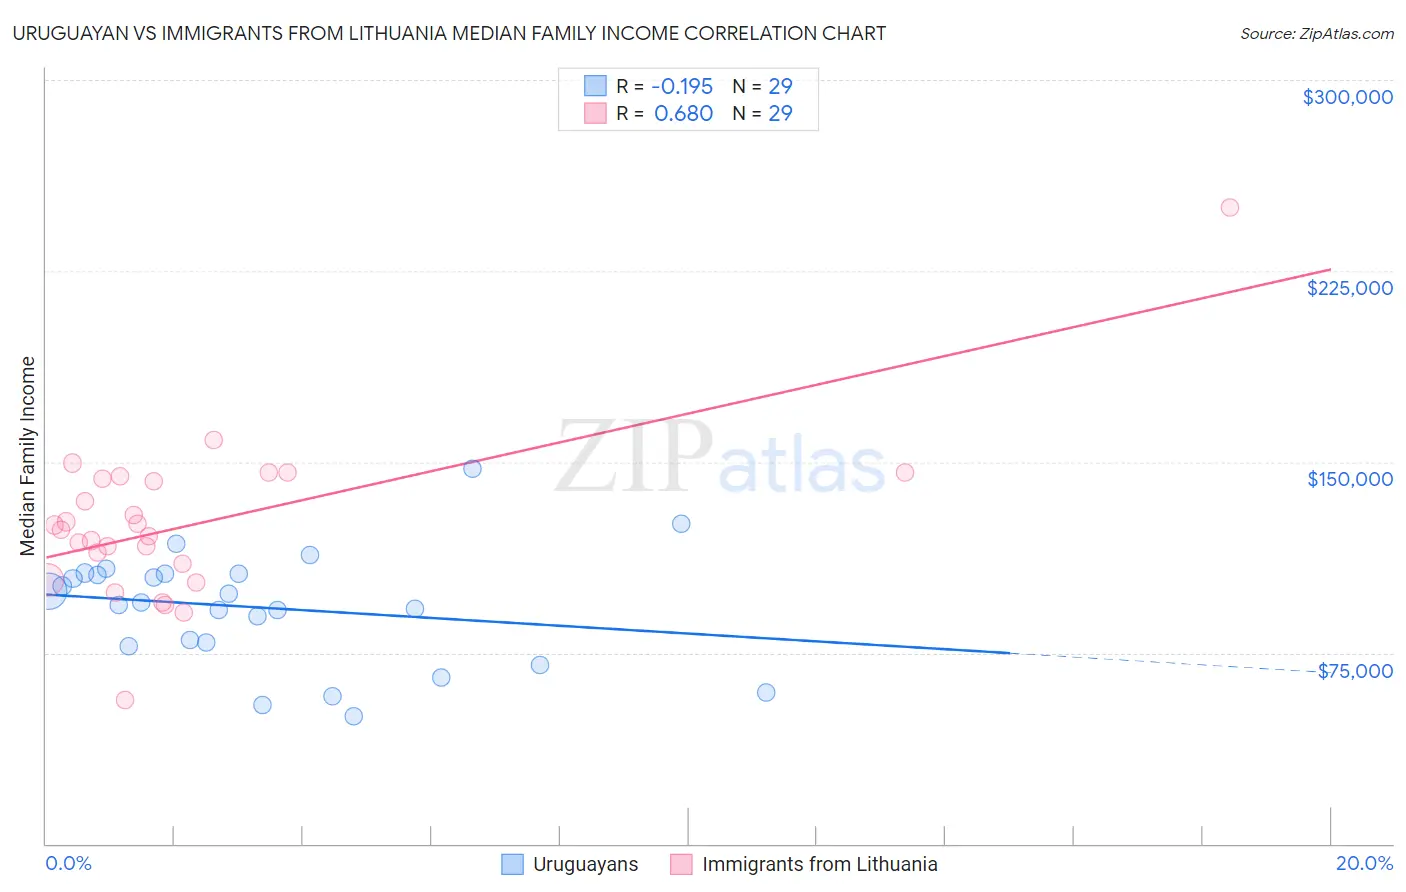
Uruguayan vs Immigrants from Lithuania Median Family Income Correlation Chart
The statistical analysis conducted on geographies consisting of 144,757,564 people shows a poor negative correlation between the proportion of Uruguayans and median family income in the United States with a correlation coefficient (R) of -0.195 and weighted average of $100,656. Similarly, the statistical analysis conducted on geographies consisting of 117,713,415 people shows a significant positive correlation between the proportion of Immigrants from Lithuania and median family income in the United States with a correlation coefficient (R) of 0.680 and weighted average of $118,053, a difference of 17.3%.
Median Family Income Correlation Summary
| Measurement | Uruguayan | Immigrants from Lithuania |
| Minimum | $50,000 | $56,363 |
| Maximum | $147,344 | $250,001 |
| Range | $97,344 | $193,638 |
| Mean | $92,799 | $125,785 |
| Median | $94,724 | $123,201 |
| Interquartile 25% (IQ1) | $78,231 | $106,762 |
| Interquartile 75% (IQ3) | $106,137 | $143,837 |
| Interquartile Range (IQR) | $27,906 | $37,076 |
| Standard Deviation (Sample) | $22,298 | $32,594 |
| Standard Deviation (Population) | $21,910 | $32,027 |
Similar Demographics by Median Family Income
Demographics Similar to Uruguayans by Median Family Income
In terms of median family income, the demographic groups most similar to Uruguayans are Iraqi ($100,658, a difference of 0.0%), Immigrants from Kenya ($100,679, a difference of 0.020%), Colombian ($100,750, a difference of 0.090%), Immigrants from South America ($100,414, a difference of 0.24%), and Immigrants ($100,962, a difference of 0.30%).
| Demographics | Rating | Rank | Median Family Income |
| Tlingit-Haida | 30.8 /100 | #187 | Fair $101,092 |
| Guamanians/Chamorros | 30.5 /100 | #188 | Fair $101,061 |
| Immigrants | Portugal | 29.6 /100 | #189 | Fair $100,984 |
| Immigrants | Immigrants | 29.4 /100 | #190 | Fair $100,962 |
| Colombians | 27.2 /100 | #191 | Fair $100,750 |
| Immigrants | Kenya | 26.5 /100 | #192 | Fair $100,679 |
| Iraqis | 26.3 /100 | #193 | Fair $100,658 |
| Uruguayans | 26.3 /100 | #194 | Fair $100,656 |
| Immigrants | South America | 23.9 /100 | #195 | Fair $100,414 |
| Samoans | 23.3 /100 | #196 | Fair $100,344 |
| Immigrants | Cameroon | 22.8 /100 | #197 | Fair $100,289 |
| Immigrants | Africa | 22.5 /100 | #198 | Fair $100,256 |
| Yugoslavians | 21.3 /100 | #199 | Fair $100,119 |
| Spanish | 20.1 /100 | #200 | Fair $99,977 |
| Immigrants | Thailand | 19.0 /100 | #201 | Poor $99,840 |
Demographics Similar to Immigrants from Lithuania by Median Family Income
In terms of median family income, the demographic groups most similar to Immigrants from Lithuania are Estonian ($118,013, a difference of 0.030%), Immigrants from Bolivia ($117,912, a difference of 0.12%), Immigrants from Asia ($118,291, a difference of 0.20%), Bulgarian ($117,818, a difference of 0.20%), and Immigrants from Turkey ($118,325, a difference of 0.23%).
| Demographics | Rating | Rank | Median Family Income |
| Bhutanese | 100.0 /100 | #33 | Exceptional $119,800 |
| Bolivians | 100.0 /100 | #34 | Exceptional $119,479 |
| Soviet Union | 100.0 /100 | #35 | Exceptional $119,262 |
| Israelis | 100.0 /100 | #36 | Exceptional $118,577 |
| Australians | 100.0 /100 | #37 | Exceptional $118,440 |
| Immigrants | Turkey | 100.0 /100 | #38 | Exceptional $118,325 |
| Immigrants | Asia | 100.0 /100 | #39 | Exceptional $118,291 |
| Immigrants | Lithuania | 100.0 /100 | #40 | Exceptional $118,053 |
| Estonians | 100.0 /100 | #41 | Exceptional $118,013 |
| Immigrants | Bolivia | 100.0 /100 | #42 | Exceptional $117,912 |
| Bulgarians | 100.0 /100 | #43 | Exceptional $117,818 |
| Cambodians | 100.0 /100 | #44 | Exceptional $117,780 |
| Immigrants | Greece | 99.9 /100 | #45 | Exceptional $117,344 |
| Immigrants | Russia | 99.9 /100 | #46 | Exceptional $116,942 |
| Immigrants | Austria | 99.9 /100 | #47 | Exceptional $116,830 |