Guatemalan vs Turkish Median Family Income
COMPARE
Guatemalan
Turkish
Median Family Income
Median Family Income Comparison
Guatemalans
Turks
$88,295
MEDIAN FAMILY INCOME
0.1/ 100
METRIC RATING
285th/ 347
METRIC RANK
$121,202
MEDIAN FAMILY INCOME
100.0/ 100
METRIC RATING
25th/ 347
METRIC RANK
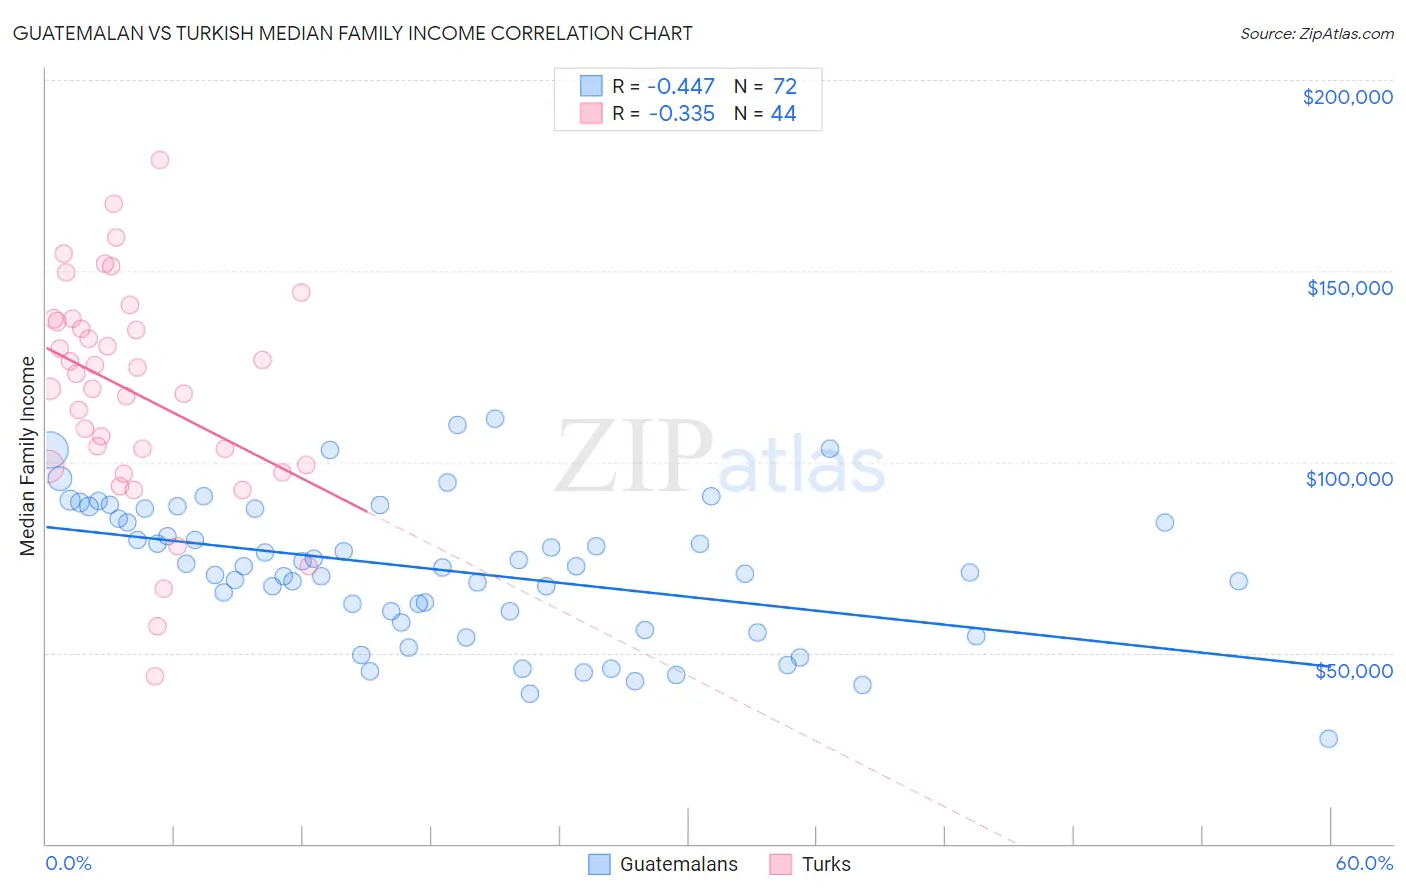
Guatemalan vs Turkish Median Family Income Correlation Chart
The statistical analysis conducted on geographies consisting of 409,160,818 people shows a moderate negative correlation between the proportion of Guatemalans and median family income in the United States with a correlation coefficient (R) of -0.447 and weighted average of $88,295. Similarly, the statistical analysis conducted on geographies consisting of 271,625,572 people shows a mild negative correlation between the proportion of Turks and median family income in the United States with a correlation coefficient (R) of -0.335 and weighted average of $121,202, a difference of 37.3%.
Median Family Income Correlation Summary
| Measurement | Guatemalan | Turkish |
| Minimum | $27,406 | $43,750 |
| Maximum | $111,362 | $179,091 |
| Range | $83,956 | $135,341 |
| Mean | $71,713 | $118,204 |
| Median | $72,451 | $121,237 |
| Interquartile 25% (IQ1) | $59,369 | $99,051 |
| Interquartile 75% (IQ3) | $86,431 | $137,062 |
| Interquartile Range (IQR) | $27,062 | $38,011 |
| Standard Deviation (Sample) | $18,247 | $28,920 |
| Standard Deviation (Population) | $18,120 | $28,590 |
Similar Demographics by Median Family Income
Demographics Similar to Guatemalans by Median Family Income
In terms of median family income, the demographic groups most similar to Guatemalans are Indonesian ($88,301, a difference of 0.010%), Immigrants from Nicaragua ($88,267, a difference of 0.030%), Potawatomi ($88,265, a difference of 0.030%), Bangladeshi ($88,358, a difference of 0.070%), and Cherokee ($88,209, a difference of 0.10%).
| Demographics | Rating | Rank | Median Family Income |
| Immigrants | Grenada | 0.1 /100 | #278 | Tragic $89,249 |
| Immigrants | Belize | 0.1 /100 | #279 | Tragic $89,197 |
| British West Indians | 0.1 /100 | #280 | Tragic $88,987 |
| Blackfeet | 0.1 /100 | #281 | Tragic $88,717 |
| Comanche | 0.1 /100 | #282 | Tragic $88,556 |
| Bangladeshis | 0.1 /100 | #283 | Tragic $88,358 |
| Indonesians | 0.1 /100 | #284 | Tragic $88,301 |
| Guatemalans | 0.1 /100 | #285 | Tragic $88,295 |
| Immigrants | Nicaragua | 0.1 /100 | #286 | Tragic $88,267 |
| Potawatomi | 0.1 /100 | #287 | Tragic $88,265 |
| Cherokee | 0.1 /100 | #288 | Tragic $88,209 |
| Central American Indians | 0.1 /100 | #289 | Tragic $88,034 |
| Shoshone | 0.1 /100 | #290 | Tragic $87,872 |
| Immigrants | Cabo Verde | 0.1 /100 | #291 | Tragic $87,830 |
| Africans | 0.1 /100 | #292 | Tragic $87,820 |
Demographics Similar to Turks by Median Family Income
In terms of median family income, the demographic groups most similar to Turks are Immigrants from Switzerland ($120,726, a difference of 0.39%), Immigrants from Northern Europe ($121,840, a difference of 0.53%), Russian ($120,487, a difference of 0.59%), Immigrants from Denmark ($120,445, a difference of 0.63%), and Latvian ($120,301, a difference of 0.75%).
| Demographics | Rating | Rank | Median Family Income |
| Immigrants | Eastern Asia | 100.0 /100 | #18 | Exceptional $125,150 |
| Immigrants | Belgium | 100.0 /100 | #19 | Exceptional $123,831 |
| Burmese | 100.0 /100 | #20 | Exceptional $123,369 |
| Immigrants | Korea | 100.0 /100 | #21 | Exceptional $122,800 |
| Immigrants | Sweden | 100.0 /100 | #22 | Exceptional $122,765 |
| Immigrants | Japan | 100.0 /100 | #23 | Exceptional $122,764 |
| Immigrants | Northern Europe | 100.0 /100 | #24 | Exceptional $121,840 |
| Turks | 100.0 /100 | #25 | Exceptional $121,202 |
| Immigrants | Switzerland | 100.0 /100 | #26 | Exceptional $120,726 |
| Russians | 100.0 /100 | #27 | Exceptional $120,487 |
| Immigrants | Denmark | 100.0 /100 | #28 | Exceptional $120,445 |
| Latvians | 100.0 /100 | #29 | Exceptional $120,301 |
| Immigrants | Sri Lanka | 100.0 /100 | #30 | Exceptional $120,263 |
| Immigrants | France | 100.0 /100 | #31 | Exceptional $120,076 |
| Asians | 100.0 /100 | #32 | Exceptional $119,955 |