Osage vs Immigrants from Czechoslovakia Median Family Income
COMPARE
Osage
Immigrants from Czechoslovakia
Median Family Income
Median Family Income Comparison
Osage
Immigrants from Czechoslovakia
$91,926
MEDIAN FAMILY INCOME
0.4/ 100
METRIC RATING
258th/ 347
METRIC RANK
$116,165
MEDIAN FAMILY INCOME
99.9/ 100
METRIC RATING
50th/ 347
METRIC RANK
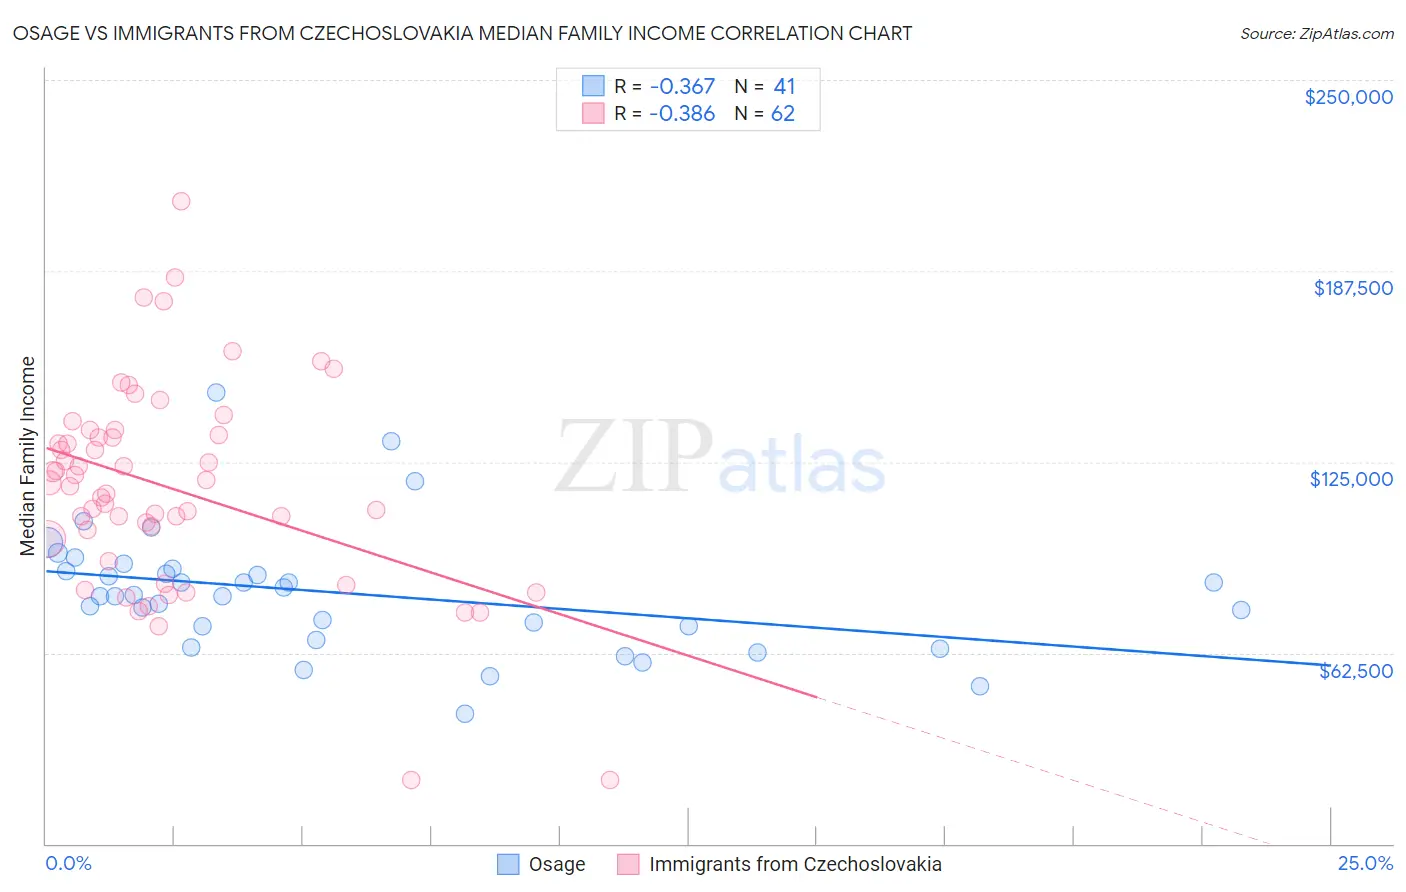
Osage vs Immigrants from Czechoslovakia Median Family Income Correlation Chart
The statistical analysis conducted on geographies consisting of 91,794,477 people shows a mild negative correlation between the proportion of Osage and median family income in the United States with a correlation coefficient (R) of -0.367 and weighted average of $91,926. Similarly, the statistical analysis conducted on geographies consisting of 195,434,997 people shows a mild negative correlation between the proportion of Immigrants from Czechoslovakia and median family income in the United States with a correlation coefficient (R) of -0.386 and weighted average of $116,165, a difference of 26.4%.
Median Family Income Correlation Summary
| Measurement | Osage | Immigrants from Czechoslovakia |
| Minimum | $42,500 | $20,761 |
| Maximum | $147,522 | $210,139 |
| Range | $105,022 | $189,378 |
| Mean | $81,978 | $116,278 |
| Median | $81,165 | $117,481 |
| Interquartile 25% (IQ1) | $68,927 | $99,688 |
| Interquartile 75% (IQ3) | $89,553 | $133,750 |
| Interquartile Range (IQR) | $20,626 | $34,062 |
| Standard Deviation (Sample) | $20,387 | $34,098 |
| Standard Deviation (Population) | $20,137 | $33,822 |
Similar Demographics by Median Family Income
Demographics Similar to Osage by Median Family Income
In terms of median family income, the demographic groups most similar to Osage are Cape Verdean ($91,848, a difference of 0.090%), Pennsylvania German ($91,763, a difference of 0.18%), American ($92,096, a difference of 0.19%), Inupiat ($91,730, a difference of 0.21%), and Liberian ($91,722, a difference of 0.22%).
| Demographics | Rating | Rank | Median Family Income |
| Immigrants | Somalia | 0.6 /100 | #251 | Tragic $92,609 |
| Immigrants | El Salvador | 0.6 /100 | #252 | Tragic $92,545 |
| Immigrants | Guyana | 0.6 /100 | #253 | Tragic $92,513 |
| Immigrants | Barbados | 0.5 /100 | #254 | Tragic $92,419 |
| Immigrants | Laos | 0.5 /100 | #255 | Tragic $92,239 |
| Nicaraguans | 0.5 /100 | #256 | Tragic $92,231 |
| Americans | 0.4 /100 | #257 | Tragic $92,096 |
| Osage | 0.4 /100 | #258 | Tragic $91,926 |
| Cape Verdeans | 0.4 /100 | #259 | Tragic $91,848 |
| Pennsylvania Germans | 0.4 /100 | #260 | Tragic $91,763 |
| Inupiat | 0.4 /100 | #261 | Tragic $91,730 |
| Liberians | 0.4 /100 | #262 | Tragic $91,722 |
| Immigrants | West Indies | 0.3 /100 | #263 | Tragic $91,588 |
| Senegalese | 0.3 /100 | #264 | Tragic $91,475 |
| Hmong | 0.3 /100 | #265 | Tragic $91,296 |
Demographics Similar to Immigrants from Czechoslovakia by Median Family Income
In terms of median family income, the demographic groups most similar to Immigrants from Czechoslovakia are Chinese ($116,188, a difference of 0.020%), Immigrants from South Africa ($116,286, a difference of 0.10%), Immigrants from Malaysia ($115,880, a difference of 0.25%), Maltese ($115,862, a difference of 0.26%), and Immigrants from Norway ($115,847, a difference of 0.27%).
| Demographics | Rating | Rank | Median Family Income |
| Bulgarians | 100.0 /100 | #43 | Exceptional $117,818 |
| Cambodians | 100.0 /100 | #44 | Exceptional $117,780 |
| Immigrants | Greece | 99.9 /100 | #45 | Exceptional $117,344 |
| Immigrants | Russia | 99.9 /100 | #46 | Exceptional $116,942 |
| Immigrants | Austria | 99.9 /100 | #47 | Exceptional $116,830 |
| Immigrants | South Africa | 99.9 /100 | #48 | Exceptional $116,286 |
| Chinese | 99.9 /100 | #49 | Exceptional $116,188 |
| Immigrants | Czechoslovakia | 99.9 /100 | #50 | Exceptional $116,165 |
| Immigrants | Malaysia | 99.9 /100 | #51 | Exceptional $115,880 |
| Maltese | 99.9 /100 | #52 | Exceptional $115,862 |
| Immigrants | Norway | 99.9 /100 | #53 | Exceptional $115,847 |
| Immigrants | Europe | 99.9 /100 | #54 | Exceptional $115,523 |
| Lithuanians | 99.8 /100 | #55 | Exceptional $115,395 |
| New Zealanders | 99.8 /100 | #56 | Exceptional $115,230 |
| Greeks | 99.8 /100 | #57 | Exceptional $115,192 |