Tlingit-Haida vs Immigrants from Morocco Median Male Earnings
COMPARE
Tlingit-Haida
Immigrants from Morocco
Median Male Earnings
Median Male Earnings Comparison
Tlingit-Haida
Immigrants from Morocco
$52,409
MEDIAN MALE EARNINGS
11.5/ 100
METRIC RATING
211th/ 347
METRIC RANK
$56,958
MEDIAN MALE EARNINGS
91.8/ 100
METRIC RATING
125th/ 347
METRIC RANK
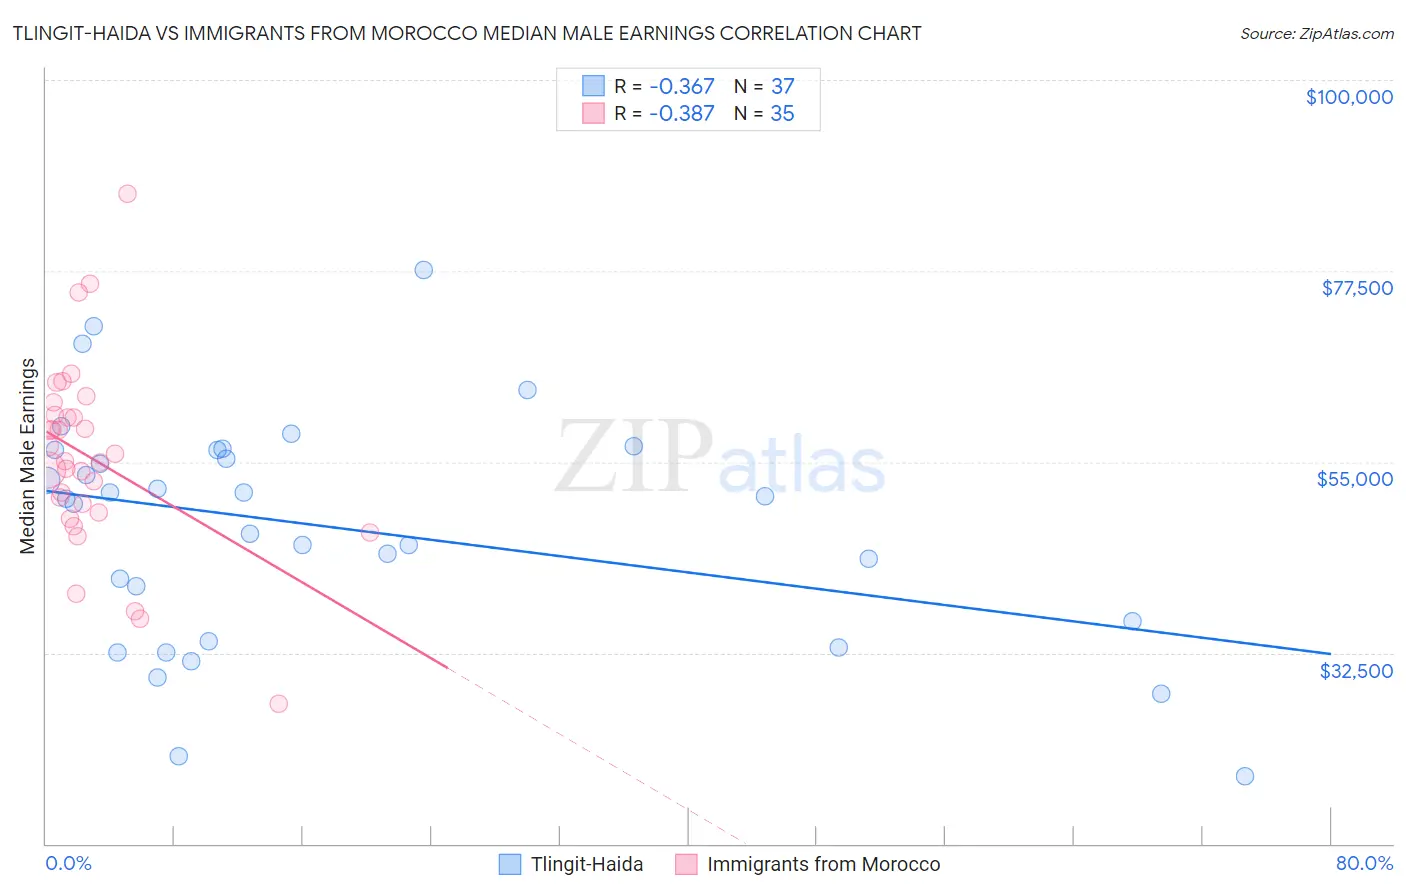
Tlingit-Haida vs Immigrants from Morocco Median Male Earnings Correlation Chart
The statistical analysis conducted on geographies consisting of 60,863,896 people shows a mild negative correlation between the proportion of Tlingit-Haida and median male earnings in the United States with a correlation coefficient (R) of -0.367 and weighted average of $52,409. Similarly, the statistical analysis conducted on geographies consisting of 178,898,918 people shows a mild negative correlation between the proportion of Immigrants from Morocco and median male earnings in the United States with a correlation coefficient (R) of -0.387 and weighted average of $56,958, a difference of 8.7%.
Median Male Earnings Correlation Summary
| Measurement | Tlingit-Haida | Immigrants from Morocco |
| Minimum | $17,917 | $26,429 |
| Maximum | $77,679 | $86,602 |
| Range | $59,762 | $60,173 |
| Mean | $47,277 | $55,429 |
| Median | $50,705 | $55,129 |
| Interquartile 25% (IQ1) | $35,036 | $49,000 |
| Interquartile 75% (IQ3) | $56,386 | $60,575 |
| Interquartile Range (IQR) | $21,350 | $11,575 |
| Standard Deviation (Sample) | $13,635 | $11,412 |
| Standard Deviation (Population) | $13,450 | $11,248 |
Similar Demographics by Median Male Earnings
Demographics Similar to Tlingit-Haida by Median Male Earnings
In terms of median male earnings, the demographic groups most similar to Tlingit-Haida are Delaware ($52,412, a difference of 0.010%), Bermudan ($52,465, a difference of 0.11%), Cajun ($52,325, a difference of 0.16%), Venezuelan ($52,510, a difference of 0.19%), and Native Hawaiian ($52,306, a difference of 0.20%).
| Demographics | Rating | Rank | Median Male Earnings |
| Ghanaians | 16.1 /100 | #204 | Poor $52,810 |
| Immigrants | Colombia | 15.0 /100 | #205 | Poor $52,725 |
| Immigrants | Iraq | 14.5 /100 | #206 | Poor $52,681 |
| Vietnamese | 12.7 /100 | #207 | Poor $52,525 |
| Venezuelans | 12.5 /100 | #208 | Poor $52,510 |
| Bermudans | 12.1 /100 | #209 | Poor $52,465 |
| Delaware | 11.5 /100 | #210 | Poor $52,412 |
| Tlingit-Haida | 11.5 /100 | #211 | Poor $52,409 |
| Cajuns | 10.7 /100 | #212 | Poor $52,325 |
| Native Hawaiians | 10.5 /100 | #213 | Poor $52,306 |
| Immigrants | Nonimmigrants | 9.3 /100 | #214 | Tragic $52,170 |
| Immigrants | Cameroon | 8.9 /100 | #215 | Tragic $52,119 |
| Immigrants | Venezuela | 8.3 /100 | #216 | Tragic $52,041 |
| Nigerians | 8.3 /100 | #217 | Tragic $52,039 |
| Immigrants | Panama | 7.7 /100 | #218 | Tragic $51,962 |
Demographics Similar to Immigrants from Morocco by Median Male Earnings
In terms of median male earnings, the demographic groups most similar to Immigrants from Morocco are Chilean ($56,973, a difference of 0.030%), Chinese ($56,872, a difference of 0.15%), Brazilian ($56,837, a difference of 0.21%), Immigrants from Syria ($56,830, a difference of 0.23%), and Immigrants from Jordan ($57,145, a difference of 0.33%).
| Demographics | Rating | Rank | Median Male Earnings |
| Hungarians | 94.0 /100 | #118 | Exceptional $57,309 |
| Arabs | 94.0 /100 | #119 | Exceptional $57,298 |
| Canadians | 93.9 /100 | #120 | Exceptional $57,286 |
| Immigrants | Albania | 93.3 /100 | #121 | Exceptional $57,179 |
| Immigrants | Jordan | 93.1 /100 | #122 | Exceptional $57,145 |
| Slovenes | 93.1 /100 | #123 | Exceptional $57,145 |
| Chileans | 91.9 /100 | #124 | Exceptional $56,973 |
| Immigrants | Morocco | 91.8 /100 | #125 | Exceptional $56,958 |
| Chinese | 91.1 /100 | #126 | Exceptional $56,872 |
| Brazilians | 90.9 /100 | #127 | Exceptional $56,837 |
| Immigrants | Syria | 90.8 /100 | #128 | Exceptional $56,830 |
| Pakistanis | 89.9 /100 | #129 | Excellent $56,719 |
| Koreans | 89.4 /100 | #130 | Excellent $56,672 |
| Portuguese | 89.4 /100 | #131 | Excellent $56,663 |
| Czechs | 88.2 /100 | #132 | Excellent $56,546 |