Guamanian/Chamorro vs Immigrants from Morocco Median Male Earnings
COMPARE
Guamanian/Chamorro
Immigrants from Morocco
Median Male Earnings
Median Male Earnings Comparison
Guamanians/Chamorros
Immigrants from Morocco
$53,661
MEDIAN MALE EARNINGS
30.7/ 100
METRIC RATING
191st/ 347
METRIC RANK
$56,958
MEDIAN MALE EARNINGS
91.8/ 100
METRIC RATING
125th/ 347
METRIC RANK
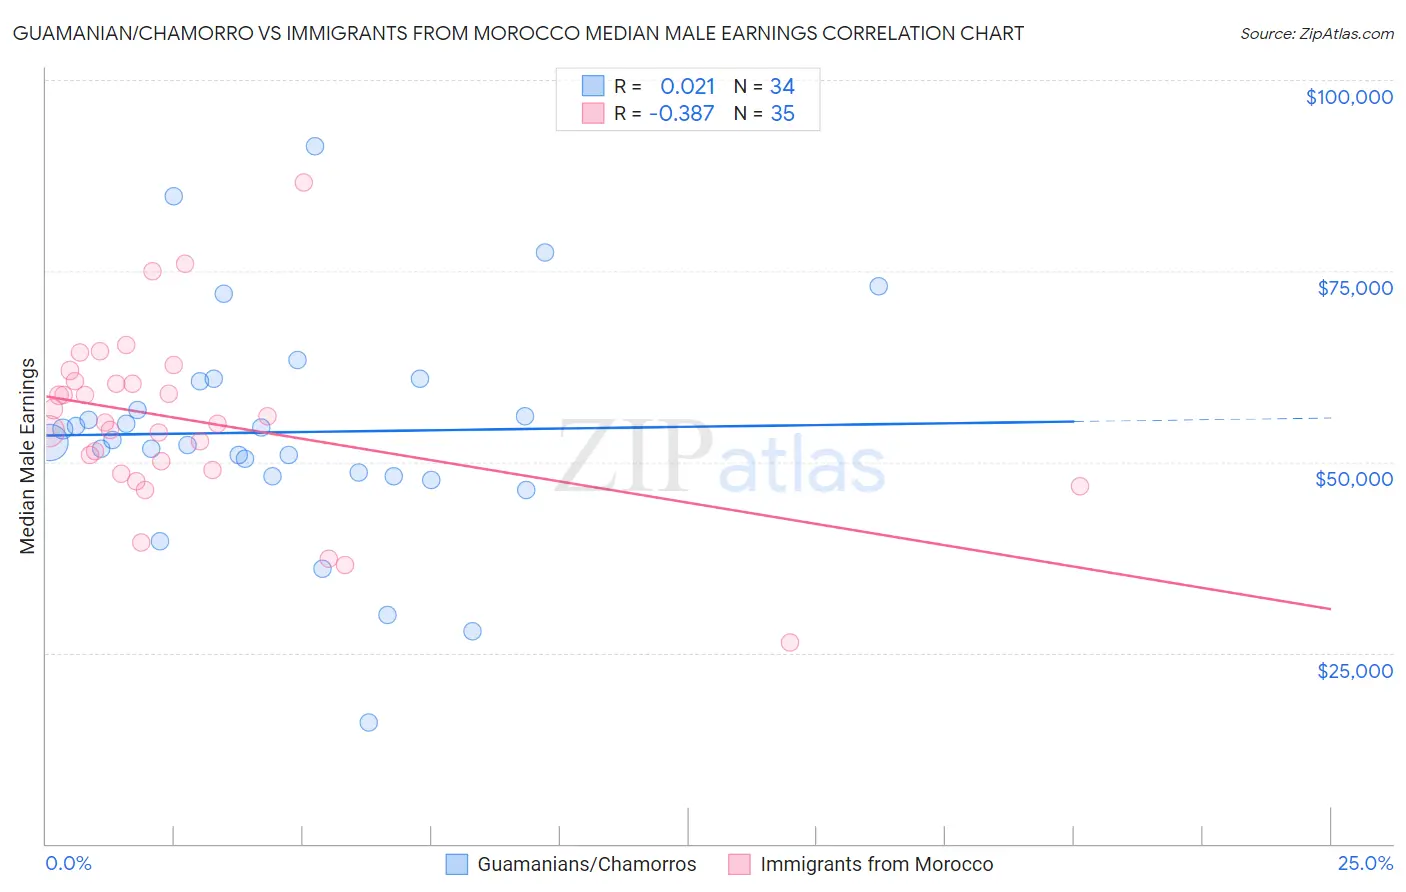
Guamanian/Chamorro vs Immigrants from Morocco Median Male Earnings Correlation Chart
The statistical analysis conducted on geographies consisting of 221,944,725 people shows no correlation between the proportion of Guamanians/Chamorros and median male earnings in the United States with a correlation coefficient (R) of 0.021 and weighted average of $53,661. Similarly, the statistical analysis conducted on geographies consisting of 178,898,918 people shows a mild negative correlation between the proportion of Immigrants from Morocco and median male earnings in the United States with a correlation coefficient (R) of -0.387 and weighted average of $56,958, a difference of 6.1%.
Median Male Earnings Correlation Summary
| Measurement | Guamanian/Chamorro | Immigrants from Morocco |
| Minimum | $15,938 | $26,429 |
| Maximum | $91,265 | $86,602 |
| Range | $75,327 | $60,173 |
| Mean | $53,880 | $55,429 |
| Median | $52,699 | $55,129 |
| Interquartile 25% (IQ1) | $48,166 | $49,000 |
| Interquartile 75% (IQ3) | $60,575 | $60,575 |
| Interquartile Range (IQR) | $12,408 | $11,575 |
| Standard Deviation (Sample) | $14,873 | $11,412 |
| Standard Deviation (Population) | $14,653 | $11,248 |
Similar Demographics by Median Male Earnings
Demographics Similar to Guamanians/Chamorros by Median Male Earnings
In terms of median male earnings, the demographic groups most similar to Guamanians/Chamorros are Scotch-Irish ($53,658, a difference of 0.010%), Kenyan ($53,647, a difference of 0.030%), Uruguayan ($53,680, a difference of 0.040%), Puget Sound Salish ($53,704, a difference of 0.080%), and Immigrants from Eritrea ($53,715, a difference of 0.10%).
| Demographics | Rating | Rank | Median Male Earnings |
| Whites/Caucasians | 36.5 /100 | #184 | Fair $53,925 |
| Immigrants | Sierra Leone | 36.0 /100 | #185 | Fair $53,905 |
| Colombians | 34.4 /100 | #186 | Fair $53,832 |
| Immigrants | Eritrea | 31.8 /100 | #187 | Fair $53,715 |
| Immigrants | Eastern Africa | 31.8 /100 | #188 | Fair $53,713 |
| Puget Sound Salish | 31.6 /100 | #189 | Fair $53,704 |
| Uruguayans | 31.1 /100 | #190 | Fair $53,680 |
| Guamanians/Chamorros | 30.7 /100 | #191 | Fair $53,661 |
| Scotch-Irish | 30.6 /100 | #192 | Fair $53,658 |
| Kenyans | 30.4 /100 | #193 | Fair $53,647 |
| Spanish | 29.0 /100 | #194 | Fair $53,576 |
| Immigrants | Azores | 27.5 /100 | #195 | Fair $53,503 |
| Immigrants | Africa | 26.6 /100 | #196 | Fair $53,457 |
| Immigrants | Kenya | 26.0 /100 | #197 | Fair $53,427 |
| Immigrants | Costa Rica | 22.6 /100 | #198 | Fair $53,237 |
Demographics Similar to Immigrants from Morocco by Median Male Earnings
In terms of median male earnings, the demographic groups most similar to Immigrants from Morocco are Chilean ($56,973, a difference of 0.030%), Chinese ($56,872, a difference of 0.15%), Brazilian ($56,837, a difference of 0.21%), Immigrants from Syria ($56,830, a difference of 0.23%), and Immigrants from Jordan ($57,145, a difference of 0.33%).
| Demographics | Rating | Rank | Median Male Earnings |
| Hungarians | 94.0 /100 | #118 | Exceptional $57,309 |
| Arabs | 94.0 /100 | #119 | Exceptional $57,298 |
| Canadians | 93.9 /100 | #120 | Exceptional $57,286 |
| Immigrants | Albania | 93.3 /100 | #121 | Exceptional $57,179 |
| Immigrants | Jordan | 93.1 /100 | #122 | Exceptional $57,145 |
| Slovenes | 93.1 /100 | #123 | Exceptional $57,145 |
| Chileans | 91.9 /100 | #124 | Exceptional $56,973 |
| Immigrants | Morocco | 91.8 /100 | #125 | Exceptional $56,958 |
| Chinese | 91.1 /100 | #126 | Exceptional $56,872 |
| Brazilians | 90.9 /100 | #127 | Exceptional $56,837 |
| Immigrants | Syria | 90.8 /100 | #128 | Exceptional $56,830 |
| Pakistanis | 89.9 /100 | #129 | Excellent $56,719 |
| Koreans | 89.4 /100 | #130 | Excellent $56,672 |
| Portuguese | 89.4 /100 | #131 | Excellent $56,663 |
| Czechs | 88.2 /100 | #132 | Excellent $56,546 |