Tlingit-Haida vs Immigrants from Morocco Single Female Poverty
COMPARE
Tlingit-Haida
Immigrants from Morocco
Single Female Poverty
Single Female Poverty Comparison
Tlingit-Haida
Immigrants from Morocco
21.9%
SINGLE FEMALE POVERTY
5.4/ 100
METRIC RATING
229th/ 347
METRIC RANK
20.2%
SINGLE FEMALE POVERTY
92.4/ 100
METRIC RATING
129th/ 347
METRIC RANK
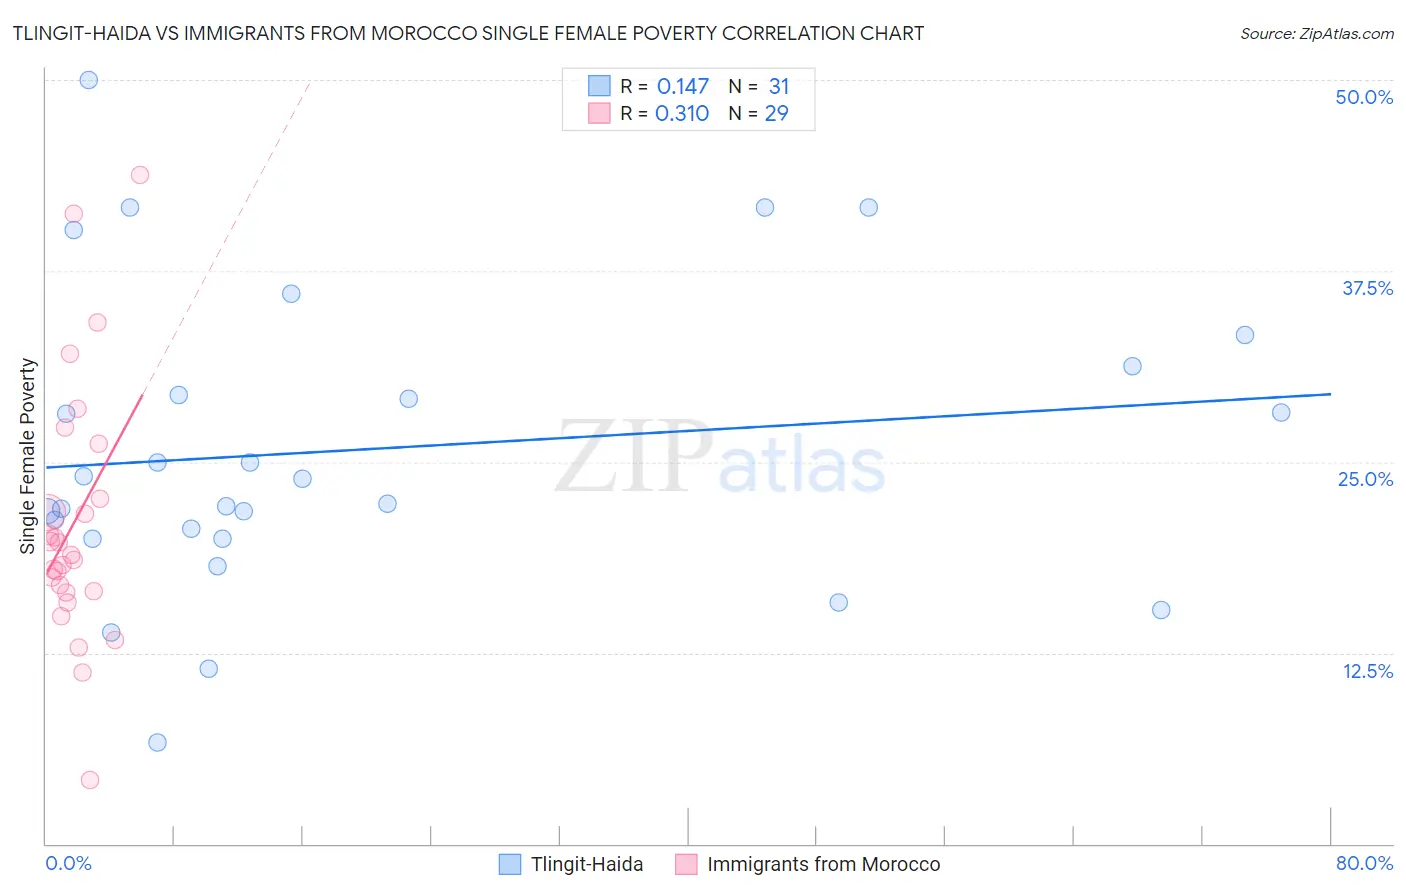
Tlingit-Haida vs Immigrants from Morocco Single Female Poverty Correlation Chart
The statistical analysis conducted on geographies consisting of 60,536,912 people shows a poor positive correlation between the proportion of Tlingit-Haida and poverty level among single females in the United States with a correlation coefficient (R) of 0.147 and weighted average of 21.9%. Similarly, the statistical analysis conducted on geographies consisting of 177,779,990 people shows a mild positive correlation between the proportion of Immigrants from Morocco and poverty level among single females in the United States with a correlation coefficient (R) of 0.310 and weighted average of 20.2%, a difference of 8.7%.
Single Female Poverty Correlation Summary
| Measurement | Tlingit-Haida | Immigrants from Morocco |
| Minimum | 6.7% | 4.1% |
| Maximum | 50.0% | 43.8% |
| Range | 43.3% | 39.6% |
| Mean | 25.9% | 21.0% |
| Median | 23.9% | 18.9% |
| Interquartile 25% (IQ1) | 20.0% | 16.5% |
| Interquartile 75% (IQ3) | 31.2% | 24.4% |
| Interquartile Range (IQR) | 11.2% | 7.9% |
| Standard Deviation (Sample) | 9.9% | 8.5% |
| Standard Deviation (Population) | 9.8% | 8.4% |
Similar Demographics by Single Female Poverty
Demographics Similar to Tlingit-Haida by Single Female Poverty
In terms of single female poverty, the demographic groups most similar to Tlingit-Haida are Immigrants from Western Africa (22.0%, a difference of 0.020%), Salvadoran (21.9%, a difference of 0.030%), Welsh (22.0%, a difference of 0.11%), Immigrants from Ghana (21.9%, a difference of 0.12%), and Immigrants from Thailand (22.0%, a difference of 0.12%).
| Demographics | Rating | Rank | Single Female Poverty |
| Immigrants | Eritrea | 7.9 /100 | #222 | Tragic 21.8% |
| Scottish | 7.3 /100 | #223 | Tragic 21.8% |
| Barbadians | 7.2 /100 | #224 | Tragic 21.8% |
| English | 6.4 /100 | #225 | Tragic 21.9% |
| Immigrants | Portugal | 5.8 /100 | #226 | Tragic 21.9% |
| Immigrants | Ghana | 5.8 /100 | #227 | Tragic 21.9% |
| Salvadorans | 5.5 /100 | #228 | Tragic 21.9% |
| Tlingit-Haida | 5.4 /100 | #229 | Tragic 21.9% |
| Immigrants | Western Africa | 5.3 /100 | #230 | Tragic 22.0% |
| Welsh | 5.0 /100 | #231 | Tragic 22.0% |
| Immigrants | Thailand | 5.0 /100 | #232 | Tragic 22.0% |
| Spaniards | 4.7 /100 | #233 | Tragic 22.0% |
| Spanish | 4.7 /100 | #234 | Tragic 22.0% |
| Dutch | 4.6 /100 | #235 | Tragic 22.0% |
| Immigrants | Ecuador | 4.2 /100 | #236 | Tragic 22.0% |
Demographics Similar to Immigrants from Morocco by Single Female Poverty
In terms of single female poverty, the demographic groups most similar to Immigrants from Morocco are Immigrants from Hungary (20.2%, a difference of 0.030%), Immigrants from Spain (20.2%, a difference of 0.080%), Pakistani (20.2%, a difference of 0.080%), Uruguayan (20.2%, a difference of 0.080%), and Immigrants from England (20.2%, a difference of 0.11%).
| Demographics | Rating | Rank | Single Female Poverty |
| Immigrants | South America | 95.0 /100 | #122 | Exceptional 20.0% |
| Brazilians | 94.4 /100 | #123 | Exceptional 20.1% |
| Immigrants | Chile | 94.3 /100 | #124 | Exceptional 20.1% |
| Immigrants | South Africa | 93.9 /100 | #125 | Exceptional 20.1% |
| Serbians | 93.3 /100 | #126 | Exceptional 20.1% |
| Mongolians | 93.2 /100 | #127 | Exceptional 20.2% |
| Immigrants | Spain | 92.7 /100 | #128 | Exceptional 20.2% |
| Immigrants | Morocco | 92.4 /100 | #129 | Exceptional 20.2% |
| Immigrants | Hungary | 92.3 /100 | #130 | Exceptional 20.2% |
| Pakistanis | 92.1 /100 | #131 | Exceptional 20.2% |
| Uruguayans | 92.1 /100 | #132 | Exceptional 20.2% |
| Immigrants | England | 91.9 /100 | #133 | Exceptional 20.2% |
| Immigrants | Venezuela | 91.5 /100 | #134 | Exceptional 20.2% |
| Immigrants | Iraq | 91.2 /100 | #135 | Exceptional 20.2% |
| Immigrants | Canada | 91.2 /100 | #136 | Exceptional 20.2% |