Tlingit-Haida vs Immigrants from Afghanistan Median Male Earnings
COMPARE
Tlingit-Haida
Immigrants from Afghanistan
Median Male Earnings
Median Male Earnings Comparison
Tlingit-Haida
Immigrants from Afghanistan
$52,409
MEDIAN MALE EARNINGS
11.5/ 100
METRIC RATING
211th/ 347
METRIC RANK
$57,582
MEDIAN MALE EARNINGS
95.4/ 100
METRIC RATING
112th/ 347
METRIC RANK
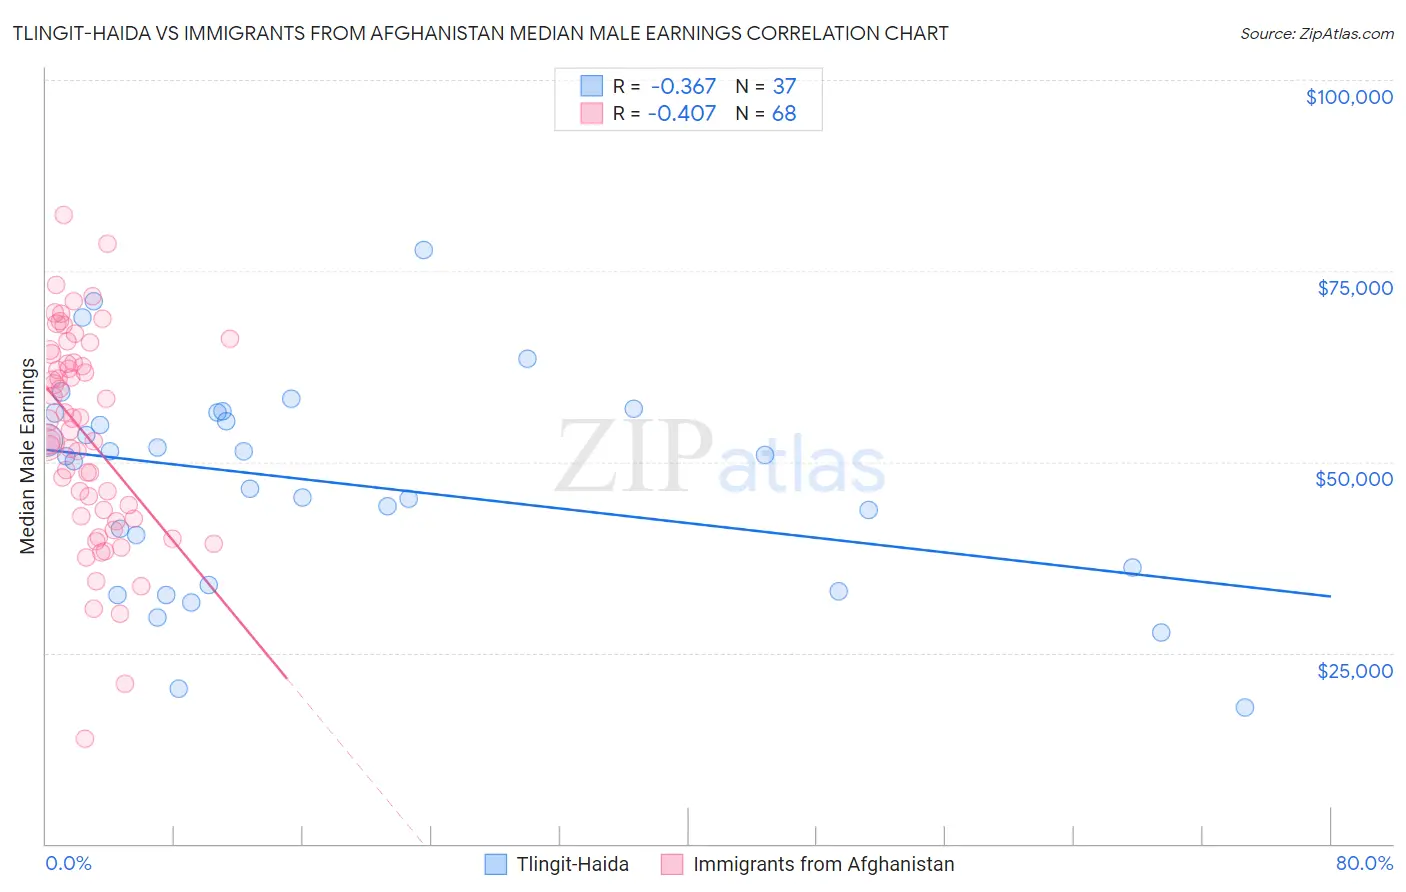
Tlingit-Haida vs Immigrants from Afghanistan Median Male Earnings Correlation Chart
The statistical analysis conducted on geographies consisting of 60,863,896 people shows a mild negative correlation between the proportion of Tlingit-Haida and median male earnings in the United States with a correlation coefficient (R) of -0.367 and weighted average of $52,409. Similarly, the statistical analysis conducted on geographies consisting of 147,642,339 people shows a moderate negative correlation between the proportion of Immigrants from Afghanistan and median male earnings in the United States with a correlation coefficient (R) of -0.407 and weighted average of $57,582, a difference of 9.9%.
Median Male Earnings Correlation Summary
| Measurement | Tlingit-Haida | Immigrants from Afghanistan |
| Minimum | $17,917 | $13,824 |
| Maximum | $77,679 | $82,319 |
| Range | $59,762 | $68,496 |
| Mean | $47,277 | $53,392 |
| Median | $50,705 | $54,756 |
| Interquartile 25% (IQ1) | $35,036 | $42,712 |
| Interquartile 75% (IQ3) | $56,386 | $63,573 |
| Interquartile Range (IQR) | $21,350 | $20,861 |
| Standard Deviation (Sample) | $13,635 | $13,746 |
| Standard Deviation (Population) | $13,450 | $13,644 |
Similar Demographics by Median Male Earnings
Demographics Similar to Tlingit-Haida by Median Male Earnings
In terms of median male earnings, the demographic groups most similar to Tlingit-Haida are Delaware ($52,412, a difference of 0.010%), Bermudan ($52,465, a difference of 0.11%), Cajun ($52,325, a difference of 0.16%), Venezuelan ($52,510, a difference of 0.19%), and Native Hawaiian ($52,306, a difference of 0.20%).
| Demographics | Rating | Rank | Median Male Earnings |
| Ghanaians | 16.1 /100 | #204 | Poor $52,810 |
| Immigrants | Colombia | 15.0 /100 | #205 | Poor $52,725 |
| Immigrants | Iraq | 14.5 /100 | #206 | Poor $52,681 |
| Vietnamese | 12.7 /100 | #207 | Poor $52,525 |
| Venezuelans | 12.5 /100 | #208 | Poor $52,510 |
| Bermudans | 12.1 /100 | #209 | Poor $52,465 |
| Delaware | 11.5 /100 | #210 | Poor $52,412 |
| Tlingit-Haida | 11.5 /100 | #211 | Poor $52,409 |
| Cajuns | 10.7 /100 | #212 | Poor $52,325 |
| Native Hawaiians | 10.5 /100 | #213 | Poor $52,306 |
| Immigrants | Nonimmigrants | 9.3 /100 | #214 | Tragic $52,170 |
| Immigrants | Cameroon | 8.9 /100 | #215 | Tragic $52,119 |
| Immigrants | Venezuela | 8.3 /100 | #216 | Tragic $52,041 |
| Nigerians | 8.3 /100 | #217 | Tragic $52,039 |
| Immigrants | Panama | 7.7 /100 | #218 | Tragic $51,962 |
Demographics Similar to Immigrants from Afghanistan by Median Male Earnings
In terms of median male earnings, the demographic groups most similar to Immigrants from Afghanistan are Carpatho Rusyn ($57,572, a difference of 0.020%), Immigrants from Kuwait ($57,562, a difference of 0.040%), European ($57,637, a difference of 0.090%), Swedish ($57,445, a difference of 0.24%), and Lebanese ($57,409, a difference of 0.30%).
| Demographics | Rating | Rank | Median Male Earnings |
| Immigrants | Western Asia | 97.3 /100 | #105 | Exceptional $58,131 |
| Immigrants | Northern Africa | 96.9 /100 | #106 | Exceptional $58,008 |
| Serbians | 96.8 /100 | #107 | Exceptional $57,975 |
| Immigrants | Uzbekistan | 96.7 /100 | #108 | Exceptional $57,941 |
| British | 96.5 /100 | #109 | Exceptional $57,890 |
| Palestinians | 96.2 /100 | #110 | Exceptional $57,778 |
| Europeans | 95.6 /100 | #111 | Exceptional $57,637 |
| Immigrants | Afghanistan | 95.4 /100 | #112 | Exceptional $57,582 |
| Carpatho Rusyns | 95.3 /100 | #113 | Exceptional $57,572 |
| Immigrants | Kuwait | 95.3 /100 | #114 | Exceptional $57,562 |
| Swedes | 94.8 /100 | #115 | Exceptional $57,445 |
| Lebanese | 94.6 /100 | #116 | Exceptional $57,409 |
| Immigrants | Zimbabwe | 94.3 /100 | #117 | Exceptional $57,352 |
| Hungarians | 94.0 /100 | #118 | Exceptional $57,309 |
| Arabs | 94.0 /100 | #119 | Exceptional $57,298 |