Tlingit-Haida vs Immigrants from Morocco Median Female Earnings
COMPARE
Tlingit-Haida
Immigrants from Morocco
Median Female Earnings
Median Female Earnings Comparison
Tlingit-Haida
Immigrants from Morocco
$39,513
MEDIAN FEMALE EARNINGS
40.5/ 100
METRIC RATING
182nd/ 347
METRIC RANK
$42,229
MEDIAN FEMALE EARNINGS
99.5/ 100
METRIC RATING
82nd/ 347
METRIC RANK
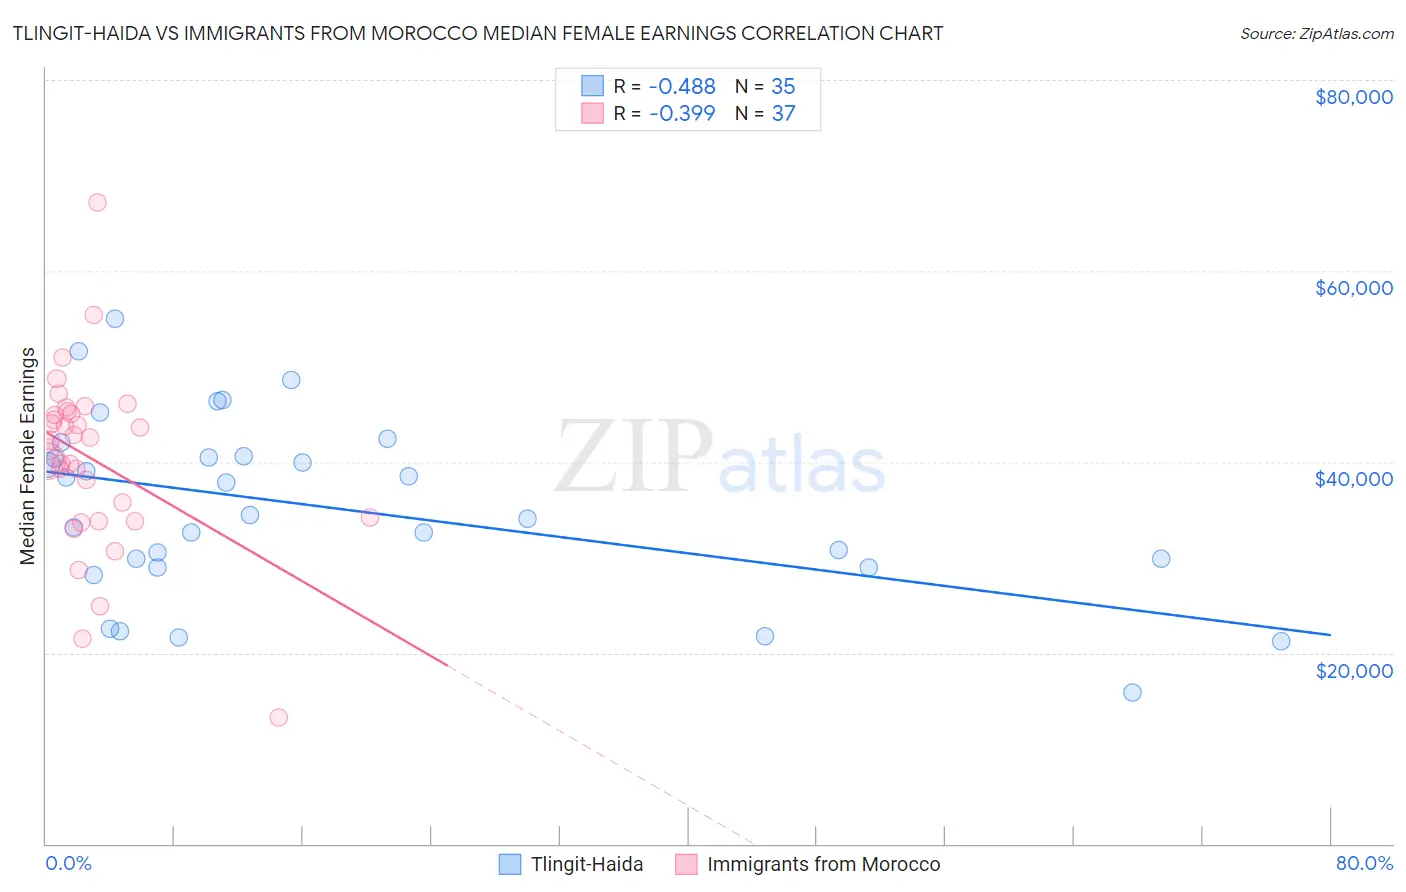
Tlingit-Haida vs Immigrants from Morocco Median Female Earnings Correlation Chart
The statistical analysis conducted on geographies consisting of 60,850,593 people shows a moderate negative correlation between the proportion of Tlingit-Haida and median female earnings in the United States with a correlation coefficient (R) of -0.488 and weighted average of $39,513. Similarly, the statistical analysis conducted on geographies consisting of 178,902,158 people shows a mild negative correlation between the proportion of Immigrants from Morocco and median female earnings in the United States with a correlation coefficient (R) of -0.399 and weighted average of $42,229, a difference of 6.9%.
Median Female Earnings Correlation Summary
| Measurement | Tlingit-Haida | Immigrants from Morocco |
| Minimum | $15,833 | $13,173 |
| Maximum | $55,000 | $67,179 |
| Range | $39,167 | $54,006 |
| Mean | $35,190 | $40,274 |
| Median | $34,397 | $42,277 |
| Interquartile 25% (IQ1) | $28,977 | $34,012 |
| Interquartile 75% (IQ3) | $40,590 | $45,224 |
| Interquartile Range (IQR) | $11,613 | $11,212 |
| Standard Deviation (Sample) | $9,336 | $9,469 |
| Standard Deviation (Population) | $9,202 | $9,340 |
Similar Demographics by Median Female Earnings
Demographics Similar to Tlingit-Haida by Median Female Earnings
In terms of median female earnings, the demographic groups most similar to Tlingit-Haida are Hungarian ($39,510, a difference of 0.010%), Tsimshian ($39,530, a difference of 0.050%), Immigrants from Kenya ($39,535, a difference of 0.060%), European ($39,457, a difference of 0.14%), and Immigrants from West Indies ($39,441, a difference of 0.18%).
| Demographics | Rating | Rank | Median Female Earnings |
| Immigrants | South America | 47.2 /100 | #175 | Average $39,643 |
| Nigerians | 47.0 /100 | #176 | Average $39,641 |
| Costa Ricans | 46.1 /100 | #177 | Average $39,622 |
| Slavs | 45.6 /100 | #178 | Average $39,613 |
| Immigrants | Germany | 45.1 /100 | #179 | Average $39,603 |
| Immigrants | Kenya | 41.6 /100 | #180 | Average $39,535 |
| Tsimshian | 41.4 /100 | #181 | Average $39,530 |
| Tlingit-Haida | 40.5 /100 | #182 | Average $39,513 |
| Hungarians | 40.3 /100 | #183 | Average $39,510 |
| Europeans | 37.7 /100 | #184 | Fair $39,457 |
| Immigrants | West Indies | 36.9 /100 | #185 | Fair $39,441 |
| Colombians | 36.9 /100 | #186 | Fair $39,439 |
| Swedes | 36.0 /100 | #187 | Fair $39,421 |
| Bermudans | 35.9 /100 | #188 | Fair $39,418 |
| Senegalese | 34.2 /100 | #189 | Fair $39,384 |
Demographics Similar to Immigrants from Morocco by Median Female Earnings
In terms of median female earnings, the demographic groups most similar to Immigrants from Morocco are Immigrants from Sierra Leone ($42,214, a difference of 0.030%), Armenian ($42,212, a difference of 0.040%), Immigrants from Southern Europe ($42,275, a difference of 0.11%), Immigrants from Moldova ($42,304, a difference of 0.18%), and Laotian ($42,133, a difference of 0.23%).
| Demographics | Rating | Rank | Median Female Earnings |
| New Zealanders | 99.7 /100 | #75 | Exceptional $42,446 |
| Immigrants | Italy | 99.7 /100 | #76 | Exceptional $42,446 |
| Immigrants | Albania | 99.6 /100 | #77 | Exceptional $42,388 |
| Immigrants | Kazakhstan | 99.6 /100 | #78 | Exceptional $42,386 |
| Greeks | 99.6 /100 | #79 | Exceptional $42,336 |
| Immigrants | Moldova | 99.6 /100 | #80 | Exceptional $42,304 |
| Immigrants | Southern Europe | 99.5 /100 | #81 | Exceptional $42,275 |
| Immigrants | Morocco | 99.5 /100 | #82 | Exceptional $42,229 |
| Immigrants | Sierra Leone | 99.5 /100 | #83 | Exceptional $42,214 |
| Armenians | 99.5 /100 | #84 | Exceptional $42,212 |
| Laotians | 99.4 /100 | #85 | Exceptional $42,133 |
| Immigrants | St. Vincent and the Grenadines | 99.3 /100 | #86 | Exceptional $42,108 |
| Lithuanians | 99.3 /100 | #87 | Exceptional $42,108 |
| Immigrants | Northern Africa | 99.3 /100 | #88 | Exceptional $42,084 |
| Immigrants | Afghanistan | 99.3 /100 | #89 | Exceptional $42,055 |