Austrian vs Immigrants from Morocco Median Male Earnings
COMPARE
Austrian
Immigrants from Morocco
Median Male Earnings
Median Male Earnings Comparison
Austrians
Immigrants from Morocco
$59,359
MEDIAN MALE EARNINGS
99.2/ 100
METRIC RATING
90th/ 347
METRIC RANK
$56,958
MEDIAN MALE EARNINGS
91.8/ 100
METRIC RATING
125th/ 347
METRIC RANK
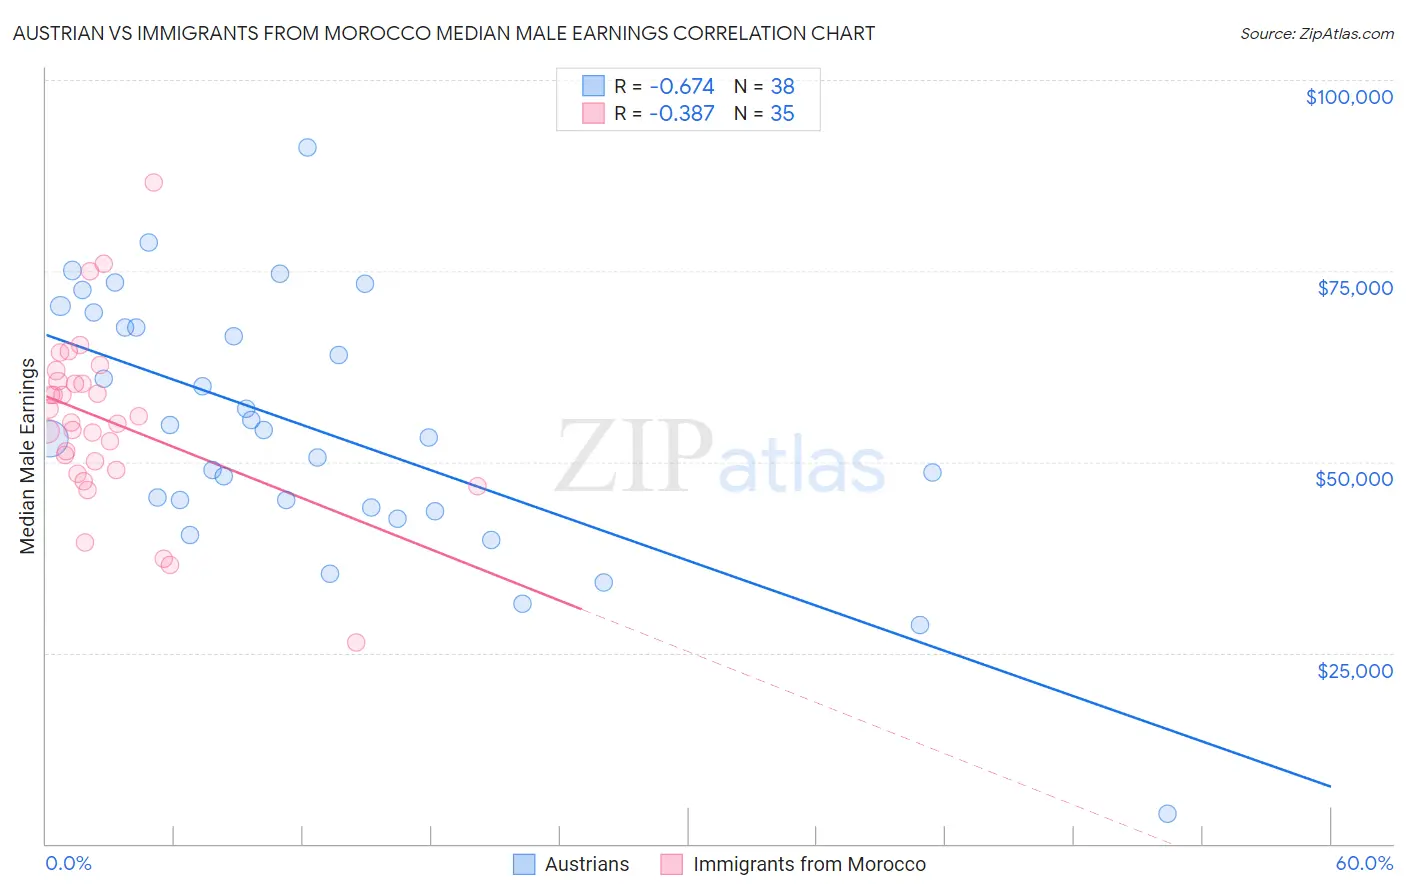
Austrian vs Immigrants from Morocco Median Male Earnings Correlation Chart
The statistical analysis conducted on geographies consisting of 451,854,520 people shows a significant negative correlation between the proportion of Austrians and median male earnings in the United States with a correlation coefficient (R) of -0.674 and weighted average of $59,359. Similarly, the statistical analysis conducted on geographies consisting of 178,898,918 people shows a mild negative correlation between the proportion of Immigrants from Morocco and median male earnings in the United States with a correlation coefficient (R) of -0.387 and weighted average of $56,958, a difference of 4.2%.
Median Male Earnings Correlation Summary
| Measurement | Austrian | Immigrants from Morocco |
| Minimum | $3,902 | $26,429 |
| Maximum | $91,143 | $86,602 |
| Range | $87,241 | $60,173 |
| Mean | $54,430 | $55,429 |
| Median | $53,632 | $55,129 |
| Interquartile 25% (IQ1) | $43,967 | $49,000 |
| Interquartile 75% (IQ3) | $67,629 | $60,575 |
| Interquartile Range (IQR) | $23,662 | $11,575 |
| Standard Deviation (Sample) | $16,958 | $11,412 |
| Standard Deviation (Population) | $16,734 | $11,248 |
Similar Demographics by Median Male Earnings
Demographics Similar to Austrians by Median Male Earnings
In terms of median male earnings, the demographic groups most similar to Austrians are Laotian ($59,351, a difference of 0.010%), Immigrants from Moldova ($59,417, a difference of 0.10%), Immigrants from Kazakhstan ($59,278, a difference of 0.14%), Immigrants from Argentina ($59,491, a difference of 0.22%), and Immigrants from Southern Europe ($59,217, a difference of 0.24%).
| Demographics | Rating | Rank | Median Male Earnings |
| Immigrants | Italy | 99.4 /100 | #83 | Exceptional $59,691 |
| Afghans | 99.3 /100 | #84 | Exceptional $59,554 |
| Italians | 99.3 /100 | #85 | Exceptional $59,551 |
| Immigrants | England | 99.3 /100 | #86 | Exceptional $59,527 |
| Macedonians | 99.3 /100 | #87 | Exceptional $59,522 |
| Immigrants | Argentina | 99.3 /100 | #88 | Exceptional $59,491 |
| Immigrants | Moldova | 99.2 /100 | #89 | Exceptional $59,417 |
| Austrians | 99.2 /100 | #90 | Exceptional $59,359 |
| Laotians | 99.2 /100 | #91 | Exceptional $59,351 |
| Immigrants | Kazakhstan | 99.1 /100 | #92 | Exceptional $59,278 |
| Immigrants | Southern Europe | 99.0 /100 | #93 | Exceptional $59,217 |
| Immigrants | North Macedonia | 99.0 /100 | #94 | Exceptional $59,189 |
| Immigrants | Lebanon | 98.6 /100 | #95 | Exceptional $58,835 |
| Albanians | 98.4 /100 | #96 | Exceptional $58,680 |
| Northern Europeans | 98.2 /100 | #97 | Exceptional $58,588 |
Demographics Similar to Immigrants from Morocco by Median Male Earnings
In terms of median male earnings, the demographic groups most similar to Immigrants from Morocco are Chilean ($56,973, a difference of 0.030%), Chinese ($56,872, a difference of 0.15%), Brazilian ($56,837, a difference of 0.21%), Immigrants from Syria ($56,830, a difference of 0.23%), and Immigrants from Jordan ($57,145, a difference of 0.33%).
| Demographics | Rating | Rank | Median Male Earnings |
| Hungarians | 94.0 /100 | #118 | Exceptional $57,309 |
| Arabs | 94.0 /100 | #119 | Exceptional $57,298 |
| Canadians | 93.9 /100 | #120 | Exceptional $57,286 |
| Immigrants | Albania | 93.3 /100 | #121 | Exceptional $57,179 |
| Immigrants | Jordan | 93.1 /100 | #122 | Exceptional $57,145 |
| Slovenes | 93.1 /100 | #123 | Exceptional $57,145 |
| Chileans | 91.9 /100 | #124 | Exceptional $56,973 |
| Immigrants | Morocco | 91.8 /100 | #125 | Exceptional $56,958 |
| Chinese | 91.1 /100 | #126 | Exceptional $56,872 |
| Brazilians | 90.9 /100 | #127 | Exceptional $56,837 |
| Immigrants | Syria | 90.8 /100 | #128 | Exceptional $56,830 |
| Pakistanis | 89.9 /100 | #129 | Excellent $56,719 |
| Koreans | 89.4 /100 | #130 | Excellent $56,672 |
| Portuguese | 89.4 /100 | #131 | Excellent $56,663 |
| Czechs | 88.2 /100 | #132 | Excellent $56,546 |