Immigrants from Burma/Myanmar vs Immigrants from Morocco Median Male Earnings
COMPARE
Immigrants from Burma/Myanmar
Immigrants from Morocco
Median Male Earnings
Median Male Earnings Comparison
Immigrants from Burma/Myanmar
Immigrants from Morocco
$50,298
MEDIAN MALE EARNINGS
1.6/ 100
METRIC RATING
249th/ 347
METRIC RANK
$56,958
MEDIAN MALE EARNINGS
91.8/ 100
METRIC RATING
125th/ 347
METRIC RANK
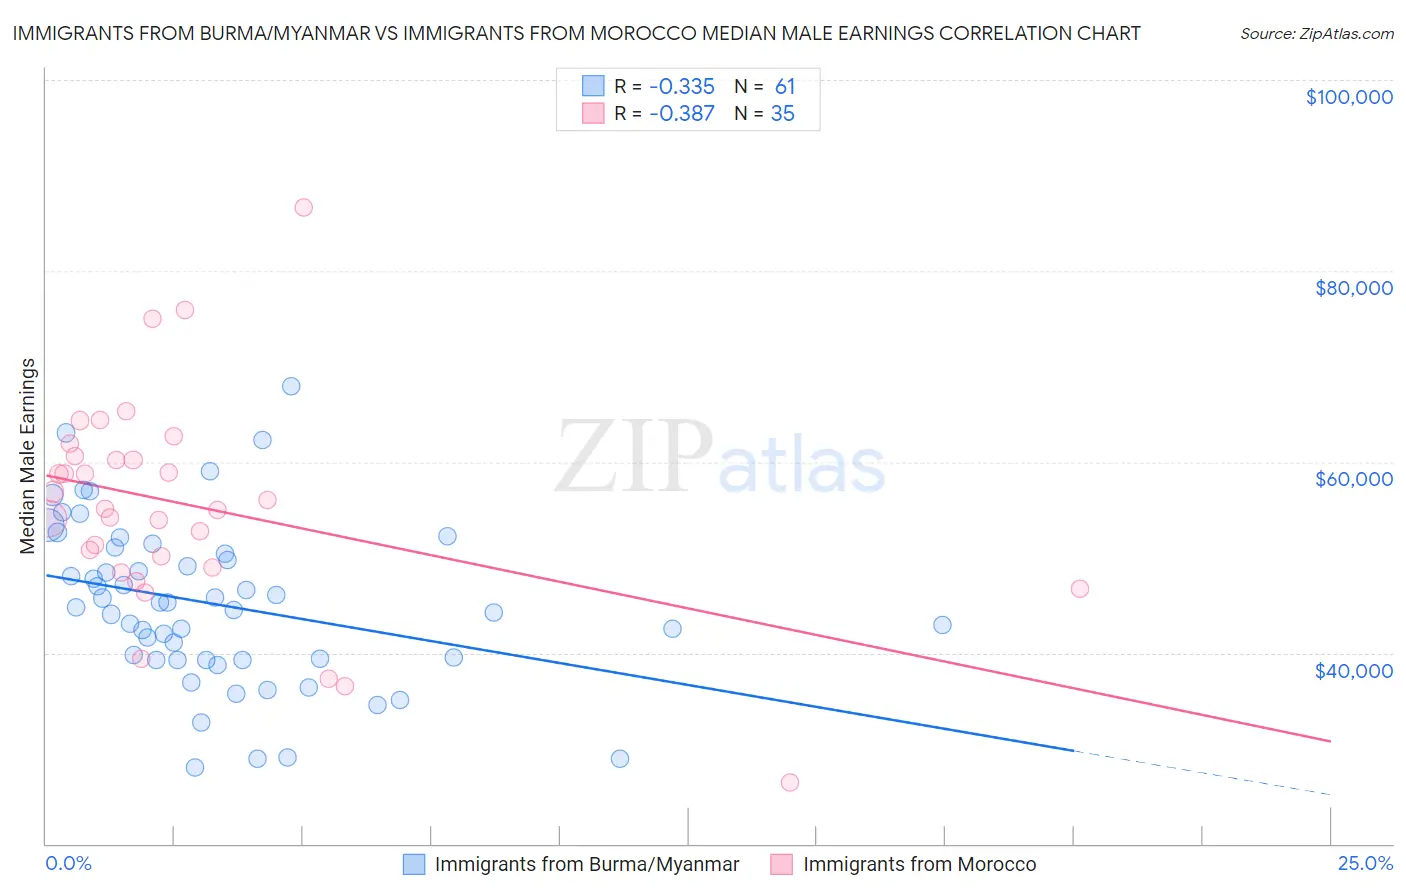
Immigrants from Burma/Myanmar vs Immigrants from Morocco Median Male Earnings Correlation Chart
The statistical analysis conducted on geographies consisting of 172,350,242 people shows a mild negative correlation between the proportion of Immigrants from Burma/Myanmar and median male earnings in the United States with a correlation coefficient (R) of -0.335 and weighted average of $50,298. Similarly, the statistical analysis conducted on geographies consisting of 178,898,918 people shows a mild negative correlation between the proportion of Immigrants from Morocco and median male earnings in the United States with a correlation coefficient (R) of -0.387 and weighted average of $56,958, a difference of 13.2%.
Median Male Earnings Correlation Summary
| Measurement | Immigrants from Burma/Myanmar | Immigrants from Morocco |
| Minimum | $27,990 | $26,429 |
| Maximum | $67,960 | $86,602 |
| Range | $39,970 | $60,173 |
| Mean | $45,043 | $55,429 |
| Median | $44,781 | $55,129 |
| Interquartile 25% (IQ1) | $39,264 | $49,000 |
| Interquartile 75% (IQ3) | $50,701 | $60,575 |
| Interquartile Range (IQR) | $11,437 | $11,575 |
| Standard Deviation (Sample) | $8,603 | $11,412 |
| Standard Deviation (Population) | $8,532 | $11,248 |
Similar Demographics by Median Male Earnings
Demographics Similar to Immigrants from Burma/Myanmar by Median Male Earnings
In terms of median male earnings, the demographic groups most similar to Immigrants from Burma/Myanmar are Osage ($50,292, a difference of 0.010%), Immigrants from Grenada ($50,279, a difference of 0.040%), Immigrants from Guyana ($50,321, a difference of 0.050%), Subsaharan African ($50,408, a difference of 0.22%), and Immigrants from Ecuador ($50,474, a difference of 0.35%).
| Demographics | Rating | Rank | Median Male Earnings |
| Guyanese | 2.2 /100 | #242 | Tragic $50,613 |
| French American Indians | 2.2 /100 | #243 | Tragic $50,611 |
| Houma | 2.0 /100 | #244 | Tragic $50,547 |
| Hawaiians | 1.9 /100 | #245 | Tragic $50,488 |
| Immigrants | Ecuador | 1.9 /100 | #246 | Tragic $50,474 |
| Sub-Saharan Africans | 1.8 /100 | #247 | Tragic $50,408 |
| Immigrants | Guyana | 1.6 /100 | #248 | Tragic $50,321 |
| Immigrants | Burma/Myanmar | 1.6 /100 | #249 | Tragic $50,298 |
| Osage | 1.6 /100 | #250 | Tragic $50,292 |
| Immigrants | Grenada | 1.6 /100 | #251 | Tragic $50,279 |
| Immigrants | Cabo Verde | 1.2 /100 | #252 | Tragic $50,009 |
| German Russians | 1.1 /100 | #253 | Tragic $49,924 |
| Senegalese | 1.0 /100 | #254 | Tragic $49,774 |
| Alaskan Athabascans | 0.9 /100 | #255 | Tragic $49,748 |
| Alaska Natives | 0.9 /100 | #256 | Tragic $49,711 |
Demographics Similar to Immigrants from Morocco by Median Male Earnings
In terms of median male earnings, the demographic groups most similar to Immigrants from Morocco are Chilean ($56,973, a difference of 0.030%), Chinese ($56,872, a difference of 0.15%), Brazilian ($56,837, a difference of 0.21%), Immigrants from Syria ($56,830, a difference of 0.23%), and Immigrants from Jordan ($57,145, a difference of 0.33%).
| Demographics | Rating | Rank | Median Male Earnings |
| Hungarians | 94.0 /100 | #118 | Exceptional $57,309 |
| Arabs | 94.0 /100 | #119 | Exceptional $57,298 |
| Canadians | 93.9 /100 | #120 | Exceptional $57,286 |
| Immigrants | Albania | 93.3 /100 | #121 | Exceptional $57,179 |
| Immigrants | Jordan | 93.1 /100 | #122 | Exceptional $57,145 |
| Slovenes | 93.1 /100 | #123 | Exceptional $57,145 |
| Chileans | 91.9 /100 | #124 | Exceptional $56,973 |
| Immigrants | Morocco | 91.8 /100 | #125 | Exceptional $56,958 |
| Chinese | 91.1 /100 | #126 | Exceptional $56,872 |
| Brazilians | 90.9 /100 | #127 | Exceptional $56,837 |
| Immigrants | Syria | 90.8 /100 | #128 | Exceptional $56,830 |
| Pakistanis | 89.9 /100 | #129 | Excellent $56,719 |
| Koreans | 89.4 /100 | #130 | Excellent $56,672 |
| Portuguese | 89.4 /100 | #131 | Excellent $56,663 |
| Czechs | 88.2 /100 | #132 | Excellent $56,546 |