Somali vs Native Hawaiian Median Male Earnings
COMPARE
Somali
Native Hawaiian
Median Male Earnings
Median Male Earnings Comparison
Somalis
Native Hawaiians
$49,025
MEDIAN MALE EARNINGS
0.5/ 100
METRIC RATING
266th/ 347
METRIC RANK
$52,306
MEDIAN MALE EARNINGS
10.5/ 100
METRIC RATING
213th/ 347
METRIC RANK
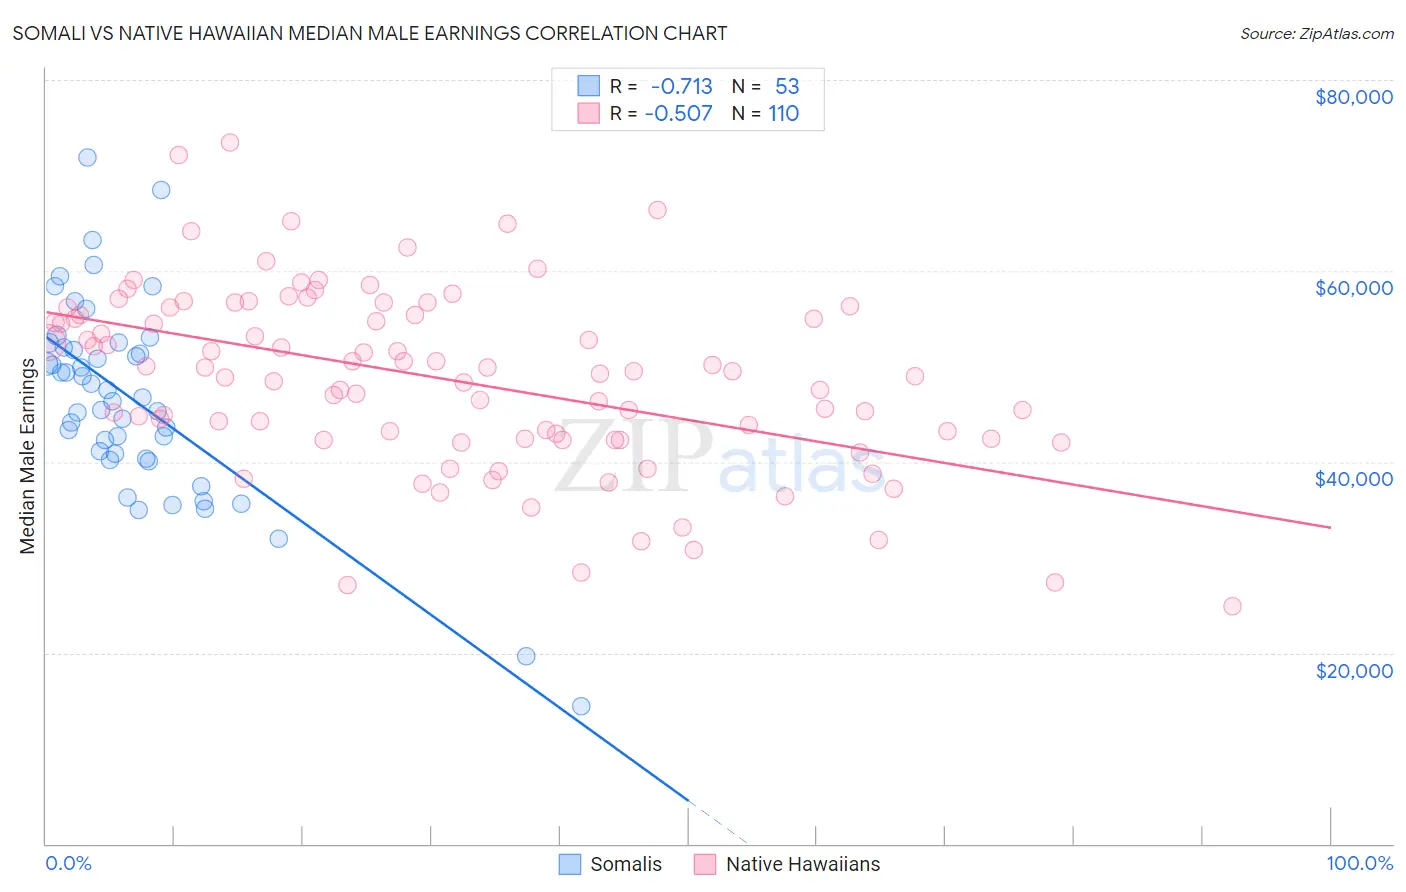
Somali vs Native Hawaiian Median Male Earnings Correlation Chart
The statistical analysis conducted on geographies consisting of 99,323,068 people shows a strong negative correlation between the proportion of Somalis and median male earnings in the United States with a correlation coefficient (R) of -0.713 and weighted average of $49,025. Similarly, the statistical analysis conducted on geographies consisting of 332,009,259 people shows a substantial negative correlation between the proportion of Native Hawaiians and median male earnings in the United States with a correlation coefficient (R) of -0.507 and weighted average of $52,306, a difference of 6.7%.
Median Male Earnings Correlation Summary
| Measurement | Somali | Native Hawaiian |
| Minimum | $14,382 | $24,830 |
| Maximum | $71,947 | $73,412 |
| Range | $57,565 | $48,582 |
| Mean | $46,539 | $48,621 |
| Median | $46,803 | $49,328 |
| Interquartile 25% (IQ1) | $40,598 | $42,387 |
| Interquartile 75% (IQ3) | $52,221 | $55,422 |
| Interquartile Range (IQR) | $11,623 | $13,035 |
| Standard Deviation (Sample) | $10,412 | $9,458 |
| Standard Deviation (Population) | $10,313 | $9,414 |
Similar Demographics by Median Male Earnings
Demographics Similar to Somalis by Median Male Earnings
In terms of median male earnings, the demographic groups most similar to Somalis are Spanish American ($49,008, a difference of 0.040%), Ute ($48,899, a difference of 0.26%), Immigrants from Laos ($49,190, a difference of 0.34%), Immigrants from Middle Africa ($49,201, a difference of 0.36%), and Nicaraguan ($49,215, a difference of 0.39%).
| Demographics | Rating | Rank | Median Male Earnings |
| Nepalese | 0.7 /100 | #259 | Tragic $49,458 |
| Iroquois | 0.7 /100 | #260 | Tragic $49,374 |
| Liberians | 0.6 /100 | #261 | Tragic $49,318 |
| Immigrants | West Indies | 0.6 /100 | #262 | Tragic $49,271 |
| Nicaraguans | 0.6 /100 | #263 | Tragic $49,215 |
| Immigrants | Middle Africa | 0.6 /100 | #264 | Tragic $49,201 |
| Immigrants | Laos | 0.6 /100 | #265 | Tragic $49,190 |
| Somalis | 0.5 /100 | #266 | Tragic $49,025 |
| Spanish Americans | 0.5 /100 | #267 | Tragic $49,008 |
| Ute | 0.4 /100 | #268 | Tragic $48,899 |
| Tsimshian | 0.4 /100 | #269 | Tragic $48,836 |
| Potawatomi | 0.4 /100 | #270 | Tragic $48,768 |
| Cherokee | 0.3 /100 | #271 | Tragic $48,669 |
| Salvadorans | 0.3 /100 | #272 | Tragic $48,646 |
| Jamaicans | 0.3 /100 | #273 | Tragic $48,632 |
Demographics Similar to Native Hawaiians by Median Male Earnings
In terms of median male earnings, the demographic groups most similar to Native Hawaiians are Cajun ($52,325, a difference of 0.040%), Delaware ($52,412, a difference of 0.20%), Tlingit-Haida ($52,409, a difference of 0.20%), Nonimmigrants ($52,170, a difference of 0.26%), and Bermudan ($52,465, a difference of 0.30%).
| Demographics | Rating | Rank | Median Male Earnings |
| Immigrants | Iraq | 14.5 /100 | #206 | Poor $52,681 |
| Vietnamese | 12.7 /100 | #207 | Poor $52,525 |
| Venezuelans | 12.5 /100 | #208 | Poor $52,510 |
| Bermudans | 12.1 /100 | #209 | Poor $52,465 |
| Delaware | 11.5 /100 | #210 | Poor $52,412 |
| Tlingit-Haida | 11.5 /100 | #211 | Poor $52,409 |
| Cajuns | 10.7 /100 | #212 | Poor $52,325 |
| Native Hawaiians | 10.5 /100 | #213 | Poor $52,306 |
| Immigrants | Nonimmigrants | 9.3 /100 | #214 | Tragic $52,170 |
| Immigrants | Cameroon | 8.9 /100 | #215 | Tragic $52,119 |
| Immigrants | Venezuela | 8.3 /100 | #216 | Tragic $52,041 |
| Nigerians | 8.3 /100 | #217 | Tragic $52,039 |
| Immigrants | Panama | 7.7 /100 | #218 | Tragic $51,962 |
| Immigrants | Ghana | 6.9 /100 | #219 | Tragic $51,836 |
| Immigrants | Armenia | 6.6 /100 | #220 | Tragic $51,793 |