Ghanaian vs Immigrants from Liberia Median Household Income
COMPARE
Ghanaian
Immigrants from Liberia
Median Household Income
Median Household Income Comparison
Ghanaians
Immigrants from Liberia
$83,582
MEDIAN HOUSEHOLD INCOME
27.4/ 100
METRIC RATING
194th/ 347
METRIC RANK
$74,896
MEDIAN HOUSEHOLD INCOME
0.1/ 100
METRIC RATING
281st/ 347
METRIC RANK
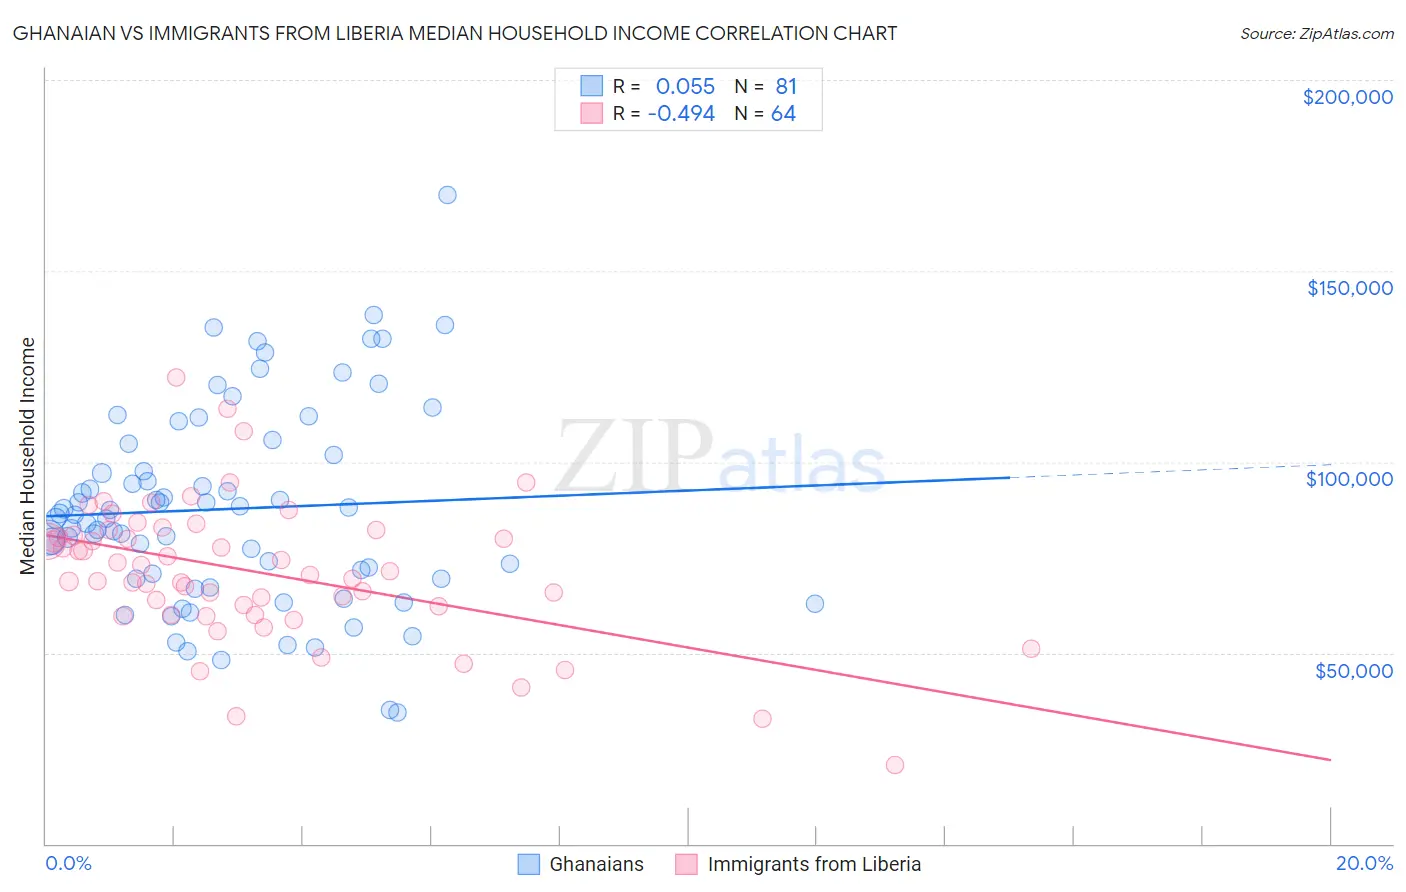
Ghanaian vs Immigrants from Liberia Median Household Income Correlation Chart
The statistical analysis conducted on geographies consisting of 190,498,021 people shows a slight positive correlation between the proportion of Ghanaians and median household income in the United States with a correlation coefficient (R) of 0.055 and weighted average of $83,582. Similarly, the statistical analysis conducted on geographies consisting of 135,245,010 people shows a moderate negative correlation between the proportion of Immigrants from Liberia and median household income in the United States with a correlation coefficient (R) of -0.494 and weighted average of $74,896, a difference of 11.6%.
Median Household Income Correlation Summary
| Measurement | Ghanaian | Immigrants from Liberia |
| Minimum | $34,375 | $20,699 |
| Maximum | $169,773 | $122,146 |
| Range | $135,398 | $101,447 |
| Mean | $87,698 | $71,180 |
| Median | $86,122 | $70,898 |
| Interquartile 25% (IQ1) | $69,414 | $61,014 |
| Interquartile 75% (IQ3) | $103,226 | $81,401 |
| Interquartile Range (IQR) | $33,812 | $20,387 |
| Standard Deviation (Sample) | $26,089 | $18,219 |
| Standard Deviation (Population) | $25,928 | $18,076 |
Similar Demographics by Median Household Income
Demographics Similar to Ghanaians by Median Household Income
In terms of median household income, the demographic groups most similar to Ghanaians are Finnish ($83,607, a difference of 0.030%), Immigrants from Armenia ($83,555, a difference of 0.030%), Welsh ($83,628, a difference of 0.060%), French ($83,468, a difference of 0.14%), and Aleut ($83,446, a difference of 0.16%).
| Demographics | Rating | Rank | Median Household Income |
| Belgians | 33.2 /100 | #187 | Fair $84,008 |
| Tlingit-Haida | 32.6 /100 | #188 | Fair $83,968 |
| Immigrants | Colombia | 31.7 /100 | #189 | Fair $83,902 |
| Slovaks | 30.2 /100 | #190 | Fair $83,798 |
| Iraqis | 29.6 /100 | #191 | Fair $83,753 |
| Welsh | 28.0 /100 | #192 | Fair $83,628 |
| Finns | 27.7 /100 | #193 | Fair $83,607 |
| Ghanaians | 27.4 /100 | #194 | Fair $83,582 |
| Immigrants | Armenia | 27.0 /100 | #195 | Fair $83,555 |
| French | 26.0 /100 | #196 | Fair $83,468 |
| Aleuts | 25.7 /100 | #197 | Fair $83,446 |
| Japanese | 25.1 /100 | #198 | Fair $83,395 |
| Germans | 24.6 /100 | #199 | Fair $83,358 |
| Tsimshian | 24.5 /100 | #200 | Fair $83,346 |
| Spanish | 24.4 /100 | #201 | Fair $83,343 |
Demographics Similar to Immigrants from Liberia by Median Household Income
In terms of median household income, the demographic groups most similar to Immigrants from Liberia are Central American Indian ($74,847, a difference of 0.070%), Senegalese ($74,999, a difference of 0.14%), Cree ($74,685, a difference of 0.28%), Immigrants from Guatemala ($75,123, a difference of 0.30%), and Yaqui ($74,596, a difference of 0.40%).
| Demographics | Rating | Rank | Median Household Income |
| British West Indians | 0.2 /100 | #274 | Tragic $75,647 |
| Immigrants | Micronesia | 0.2 /100 | #275 | Tragic $75,574 |
| Immigrants | Latin America | 0.2 /100 | #276 | Tragic $75,420 |
| Spanish Americans | 0.2 /100 | #277 | Tragic $75,386 |
| Osage | 0.2 /100 | #278 | Tragic $75,240 |
| Immigrants | Guatemala | 0.2 /100 | #279 | Tragic $75,123 |
| Senegalese | 0.2 /100 | #280 | Tragic $74,999 |
| Immigrants | Liberia | 0.1 /100 | #281 | Tragic $74,896 |
| Central American Indians | 0.1 /100 | #282 | Tragic $74,847 |
| Cree | 0.1 /100 | #283 | Tragic $74,685 |
| Yaqui | 0.1 /100 | #284 | Tragic $74,596 |
| Mexicans | 0.1 /100 | #285 | Tragic $74,399 |
| Immigrants | Somalia | 0.1 /100 | #286 | Tragic $74,300 |
| Iroquois | 0.1 /100 | #287 | Tragic $74,279 |
| Immigrants | Central America | 0.1 /100 | #288 | Tragic $74,217 |