Polish vs Immigrants from Japan Median Household Income
COMPARE
Polish
Immigrants from Japan
Median Household Income
Median Household Income Comparison
Poles
Immigrants from Japan
$88,472
MEDIAN HOUSEHOLD INCOME
89.7/ 100
METRIC RATING
136th/ 347
METRIC RANK
$100,711
MEDIAN HOUSEHOLD INCOME
100.0/ 100
METRIC RATING
24th/ 347
METRIC RANK
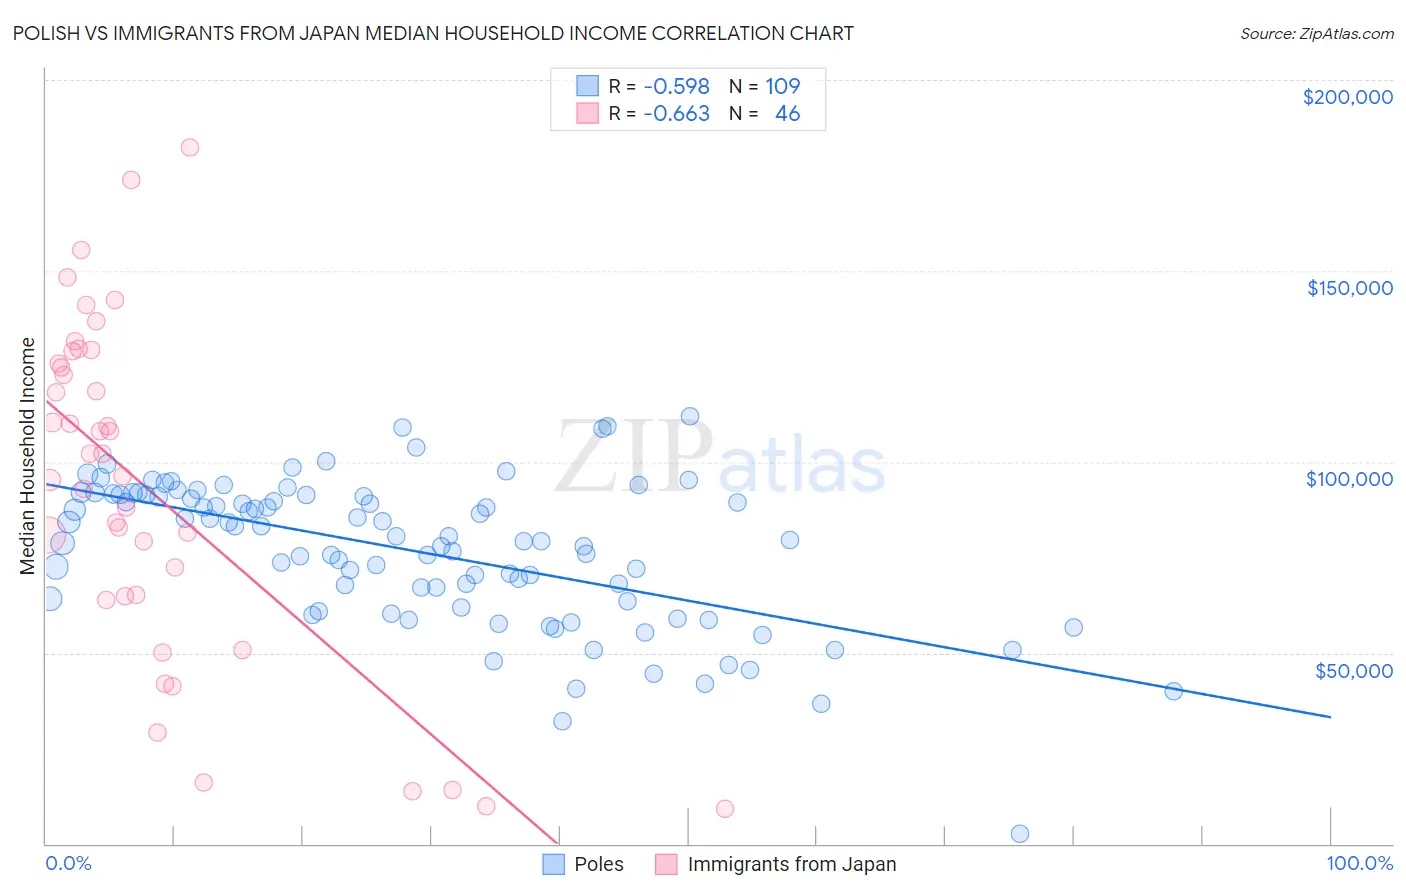
Polish vs Immigrants from Japan Median Household Income Correlation Chart
The statistical analysis conducted on geographies consisting of 559,571,407 people shows a substantial negative correlation between the proportion of Poles and median household income in the United States with a correlation coefficient (R) of -0.598 and weighted average of $88,472. Similarly, the statistical analysis conducted on geographies consisting of 339,951,010 people shows a significant negative correlation between the proportion of Immigrants from Japan and median household income in the United States with a correlation coefficient (R) of -0.663 and weighted average of $100,711, a difference of 13.8%.
Median Household Income Correlation Summary
| Measurement | Polish | Immigrants from Japan |
| Minimum | $2,499 | $9,145 |
| Maximum | $112,083 | $182,188 |
| Range | $109,584 | $173,043 |
| Mean | $76,577 | $93,083 |
| Median | $79,444 | $99,144 |
| Interquartile 25% (IQ1) | $62,696 | $64,688 |
| Interquartile 75% (IQ3) | $91,347 | $125,805 |
| Interquartile Range (IQR) | $28,651 | $61,117 |
| Standard Deviation (Sample) | $19,210 | $44,275 |
| Standard Deviation (Population) | $19,121 | $43,791 |
Similar Demographics by Median Household Income
Demographics Similar to Poles by Median Household Income
In terms of median household income, the demographic groups most similar to Poles are Sierra Leonean ($88,463, a difference of 0.010%), Immigrants from Sierra Leone ($88,498, a difference of 0.030%), Swedish ($88,524, a difference of 0.060%), Arab ($88,398, a difference of 0.080%), and Immigrants from Chile ($88,388, a difference of 0.090%).
| Demographics | Rating | Rank | Median Household Income |
| Brazilians | 92.1 /100 | #129 | Exceptional $88,934 |
| British | 92.0 /100 | #130 | Exceptional $88,914 |
| Immigrants | Syria | 91.4 /100 | #131 | Exceptional $88,792 |
| Europeans | 91.2 /100 | #132 | Exceptional $88,751 |
| Immigrants | Ethiopia | 90.9 /100 | #133 | Exceptional $88,687 |
| Swedes | 90.0 /100 | #134 | Exceptional $88,524 |
| Immigrants | Sierra Leone | 89.9 /100 | #135 | Excellent $88,498 |
| Poles | 89.7 /100 | #136 | Excellent $88,472 |
| Sierra Leoneans | 89.6 /100 | #137 | Excellent $88,463 |
| Arabs | 89.2 /100 | #138 | Excellent $88,398 |
| Immigrants | Chile | 89.2 /100 | #139 | Excellent $88,388 |
| Lebanese | 87.2 /100 | #140 | Excellent $88,091 |
| Immigrants | Morocco | 86.0 /100 | #141 | Excellent $87,930 |
| Canadians | 84.7 /100 | #142 | Excellent $87,769 |
| Danes | 83.9 /100 | #143 | Excellent $87,676 |
Demographics Similar to Immigrants from Japan by Median Household Income
In terms of median household income, the demographic groups most similar to Immigrants from Japan are Immigrants from Sweden ($100,699, a difference of 0.010%), Immigrants from Belgium ($100,306, a difference of 0.40%), Bhutanese ($100,151, a difference of 0.56%), Immigrants from Bolivia ($101,394, a difference of 0.68%), and Immigrants from Sri Lanka ($99,943, a difference of 0.77%).
| Demographics | Rating | Rank | Median Household Income |
| Immigrants | Korea | 100.0 /100 | #17 | Exceptional $102,962 |
| Cypriots | 100.0 /100 | #18 | Exceptional $102,843 |
| Immigrants | Australia | 100.0 /100 | #19 | Exceptional $102,562 |
| Bolivians | 100.0 /100 | #20 | Exceptional $102,195 |
| Eastern Europeans | 100.0 /100 | #21 | Exceptional $101,781 |
| Asians | 100.0 /100 | #22 | Exceptional $101,681 |
| Immigrants | Bolivia | 100.0 /100 | #23 | Exceptional $101,394 |
| Immigrants | Japan | 100.0 /100 | #24 | Exceptional $100,711 |
| Immigrants | Sweden | 100.0 /100 | #25 | Exceptional $100,699 |
| Immigrants | Belgium | 100.0 /100 | #26 | Exceptional $100,306 |
| Bhutanese | 100.0 /100 | #27 | Exceptional $100,151 |
| Immigrants | Sri Lanka | 100.0 /100 | #28 | Exceptional $99,943 |
| Immigrants | Asia | 100.0 /100 | #29 | Exceptional $99,933 |
| Immigrants | Northern Europe | 100.0 /100 | #30 | Exceptional $99,813 |
| Turks | 100.0 /100 | #31 | Exceptional $99,389 |