Polish vs Immigrants from Nicaragua Median Household Income
COMPARE
Polish
Immigrants from Nicaragua
Median Household Income
Median Household Income Comparison
Poles
Immigrants from Nicaragua
$88,472
MEDIAN HOUSEHOLD INCOME
89.7/ 100
METRIC RATING
136th/ 347
METRIC RANK
$76,784
MEDIAN HOUSEHOLD INCOME
0.5/ 100
METRIC RATING
258th/ 347
METRIC RANK
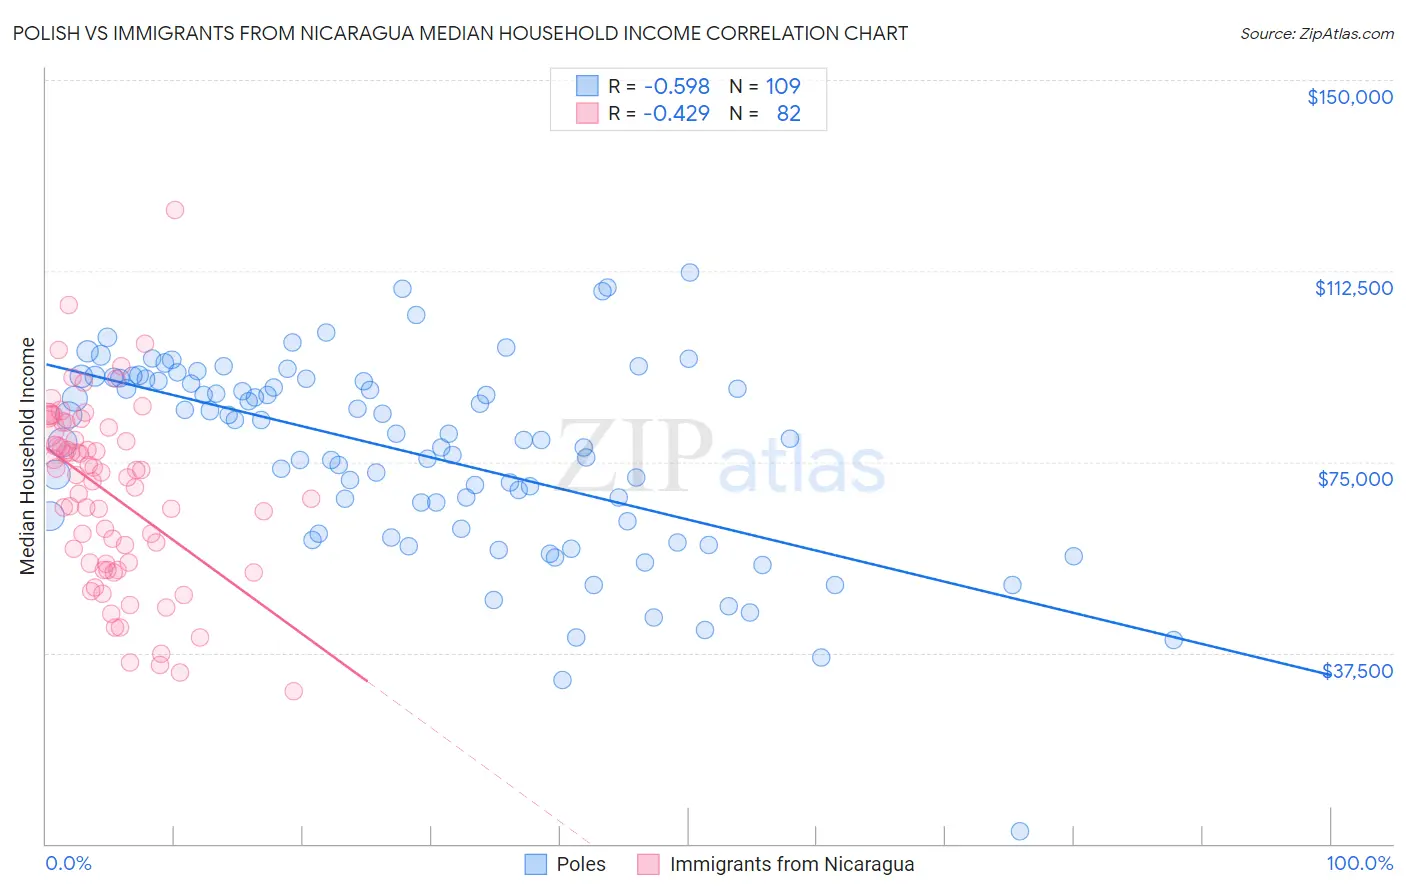
Polish vs Immigrants from Nicaragua Median Household Income Correlation Chart
The statistical analysis conducted on geographies consisting of 559,571,407 people shows a substantial negative correlation between the proportion of Poles and median household income in the United States with a correlation coefficient (R) of -0.598 and weighted average of $88,472. Similarly, the statistical analysis conducted on geographies consisting of 236,313,434 people shows a moderate negative correlation between the proportion of Immigrants from Nicaragua and median household income in the United States with a correlation coefficient (R) of -0.429 and weighted average of $76,784, a difference of 15.2%.
Median Household Income Correlation Summary
| Measurement | Polish | Immigrants from Nicaragua |
| Minimum | $2,499 | $29,878 |
| Maximum | $112,083 | $124,491 |
| Range | $109,584 | $94,613 |
| Mean | $76,577 | $68,743 |
| Median | $79,444 | $72,189 |
| Interquartile 25% (IQ1) | $62,696 | $54,917 |
| Interquartile 75% (IQ3) | $91,347 | $81,583 |
| Interquartile Range (IQR) | $28,651 | $26,666 |
| Standard Deviation (Sample) | $19,210 | $17,913 |
| Standard Deviation (Population) | $19,121 | $17,803 |
Similar Demographics by Median Household Income
Demographics Similar to Poles by Median Household Income
In terms of median household income, the demographic groups most similar to Poles are Sierra Leonean ($88,463, a difference of 0.010%), Immigrants from Sierra Leone ($88,498, a difference of 0.030%), Swedish ($88,524, a difference of 0.060%), Arab ($88,398, a difference of 0.080%), and Immigrants from Chile ($88,388, a difference of 0.090%).
| Demographics | Rating | Rank | Median Household Income |
| Brazilians | 92.1 /100 | #129 | Exceptional $88,934 |
| British | 92.0 /100 | #130 | Exceptional $88,914 |
| Immigrants | Syria | 91.4 /100 | #131 | Exceptional $88,792 |
| Europeans | 91.2 /100 | #132 | Exceptional $88,751 |
| Immigrants | Ethiopia | 90.9 /100 | #133 | Exceptional $88,687 |
| Swedes | 90.0 /100 | #134 | Exceptional $88,524 |
| Immigrants | Sierra Leone | 89.9 /100 | #135 | Excellent $88,498 |
| Poles | 89.7 /100 | #136 | Excellent $88,472 |
| Sierra Leoneans | 89.6 /100 | #137 | Excellent $88,463 |
| Arabs | 89.2 /100 | #138 | Excellent $88,398 |
| Immigrants | Chile | 89.2 /100 | #139 | Excellent $88,388 |
| Lebanese | 87.2 /100 | #140 | Excellent $88,091 |
| Immigrants | Morocco | 86.0 /100 | #141 | Excellent $87,930 |
| Canadians | 84.7 /100 | #142 | Excellent $87,769 |
| Danes | 83.9 /100 | #143 | Excellent $87,676 |
Demographics Similar to Immigrants from Nicaragua by Median Household Income
In terms of median household income, the demographic groups most similar to Immigrants from Nicaragua are Spanish American Indian ($76,670, a difference of 0.15%), Immigrants from Senegal ($76,915, a difference of 0.17%), Jamaican ($76,583, a difference of 0.26%), Belizean ($77,028, a difference of 0.32%), and Immigrants from Grenada ($76,517, a difference of 0.35%).
| Demographics | Rating | Rank | Median Household Income |
| Mexican American Indians | 1.2 /100 | #251 | Tragic $78,166 |
| Immigrants | West Indies | 1.0 /100 | #252 | Tragic $77,956 |
| Immigrants | St. Vincent and the Grenadines | 0.9 /100 | #253 | Tragic $77,690 |
| Sub-Saharan Africans | 0.8 /100 | #254 | Tragic $77,631 |
| Immigrants | Middle Africa | 0.8 /100 | #255 | Tragic $77,559 |
| Belizeans | 0.6 /100 | #256 | Tragic $77,028 |
| Immigrants | Senegal | 0.5 /100 | #257 | Tragic $76,915 |
| Immigrants | Nicaragua | 0.5 /100 | #258 | Tragic $76,784 |
| Spanish American Indians | 0.4 /100 | #259 | Tragic $76,670 |
| Jamaicans | 0.4 /100 | #260 | Tragic $76,583 |
| Immigrants | Grenada | 0.4 /100 | #261 | Tragic $76,517 |
| French American Indians | 0.4 /100 | #262 | Tragic $76,387 |
| Alaskan Athabascans | 0.4 /100 | #263 | Tragic $76,383 |
| Guatemalans | 0.3 /100 | #264 | Tragic $75,961 |
| Immigrants | Belize | 0.3 /100 | #265 | Tragic $75,938 |