Polish vs Cape Verdean Median Household Income
COMPARE
Polish
Cape Verdean
Median Household Income
Median Household Income Comparison
Poles
Cape Verdeans
$88,472
MEDIAN HOUSEHOLD INCOME
89.7/ 100
METRIC RATING
136th/ 347
METRIC RANK
$75,848
MEDIAN HOUSEHOLD INCOME
0.3/ 100
METRIC RATING
269th/ 347
METRIC RANK
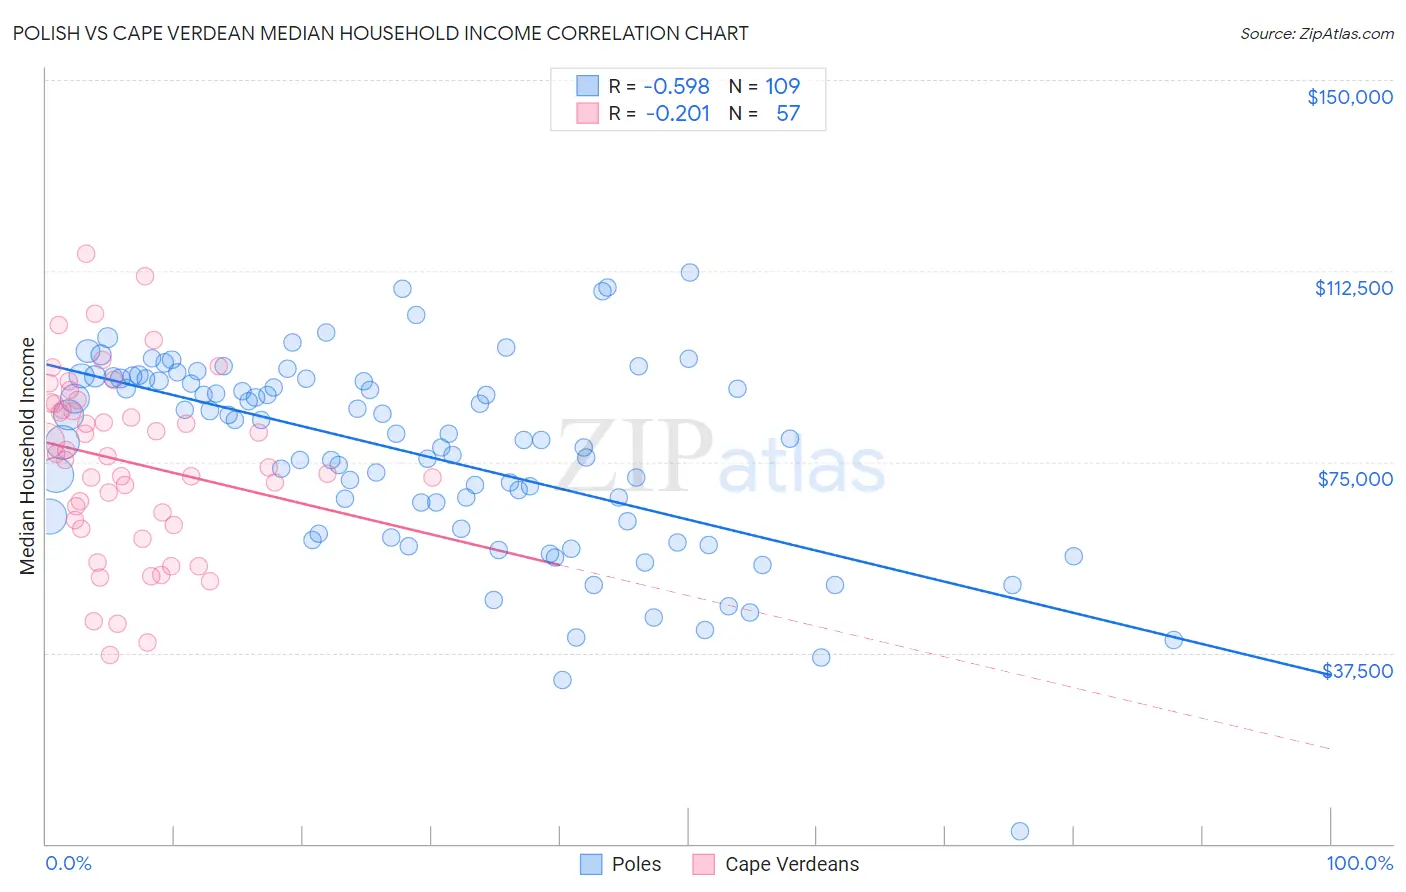
Polish vs Cape Verdean Median Household Income Correlation Chart
The statistical analysis conducted on geographies consisting of 559,571,407 people shows a substantial negative correlation between the proportion of Poles and median household income in the United States with a correlation coefficient (R) of -0.598 and weighted average of $88,472. Similarly, the statistical analysis conducted on geographies consisting of 107,534,548 people shows a weak negative correlation between the proportion of Cape Verdeans and median household income in the United States with a correlation coefficient (R) of -0.201 and weighted average of $75,848, a difference of 16.6%.
Median Household Income Correlation Summary
| Measurement | Polish | Cape Verdean |
| Minimum | $2,499 | $37,158 |
| Maximum | $112,083 | $115,791 |
| Range | $109,584 | $78,633 |
| Mean | $76,577 | $75,036 |
| Median | $79,444 | $76,048 |
| Interquartile 25% (IQ1) | $62,696 | $63,051 |
| Interquartile 75% (IQ3) | $91,347 | $86,492 |
| Interquartile Range (IQR) | $28,651 | $23,441 |
| Standard Deviation (Sample) | $19,210 | $17,562 |
| Standard Deviation (Population) | $19,121 | $17,408 |
Similar Demographics by Median Household Income
Demographics Similar to Poles by Median Household Income
In terms of median household income, the demographic groups most similar to Poles are Sierra Leonean ($88,463, a difference of 0.010%), Immigrants from Sierra Leone ($88,498, a difference of 0.030%), Swedish ($88,524, a difference of 0.060%), Arab ($88,398, a difference of 0.080%), and Immigrants from Chile ($88,388, a difference of 0.090%).
| Demographics | Rating | Rank | Median Household Income |
| Brazilians | 92.1 /100 | #129 | Exceptional $88,934 |
| British | 92.0 /100 | #130 | Exceptional $88,914 |
| Immigrants | Syria | 91.4 /100 | #131 | Exceptional $88,792 |
| Europeans | 91.2 /100 | #132 | Exceptional $88,751 |
| Immigrants | Ethiopia | 90.9 /100 | #133 | Exceptional $88,687 |
| Swedes | 90.0 /100 | #134 | Exceptional $88,524 |
| Immigrants | Sierra Leone | 89.9 /100 | #135 | Excellent $88,498 |
| Poles | 89.7 /100 | #136 | Excellent $88,472 |
| Sierra Leoneans | 89.6 /100 | #137 | Excellent $88,463 |
| Arabs | 89.2 /100 | #138 | Excellent $88,398 |
| Immigrants | Chile | 89.2 /100 | #139 | Excellent $88,388 |
| Lebanese | 87.2 /100 | #140 | Excellent $88,091 |
| Immigrants | Morocco | 86.0 /100 | #141 | Excellent $87,930 |
| Canadians | 84.7 /100 | #142 | Excellent $87,769 |
| Danes | 83.9 /100 | #143 | Excellent $87,676 |
Demographics Similar to Cape Verdeans by Median Household Income
In terms of median household income, the demographic groups most similar to Cape Verdeans are Immigrants from Jamaica ($75,851, a difference of 0.0%), German Russian ($75,856, a difference of 0.010%), Hmong ($75,839, a difference of 0.010%), Pennsylvania German ($75,814, a difference of 0.050%), and Somali ($75,782, a difference of 0.090%).
| Demographics | Rating | Rank | Median Household Income |
| French American Indians | 0.4 /100 | #262 | Tragic $76,387 |
| Alaskan Athabascans | 0.4 /100 | #263 | Tragic $76,383 |
| Guatemalans | 0.3 /100 | #264 | Tragic $75,961 |
| Immigrants | Belize | 0.3 /100 | #265 | Tragic $75,938 |
| Americans | 0.3 /100 | #266 | Tragic $75,932 |
| German Russians | 0.3 /100 | #267 | Tragic $75,856 |
| Immigrants | Jamaica | 0.3 /100 | #268 | Tragic $75,851 |
| Cape Verdeans | 0.3 /100 | #269 | Tragic $75,848 |
| Hmong | 0.3 /100 | #270 | Tragic $75,839 |
| Pennsylvania Germans | 0.3 /100 | #271 | Tragic $75,814 |
| Somalis | 0.3 /100 | #272 | Tragic $75,782 |
| Liberians | 0.2 /100 | #273 | Tragic $75,667 |
| British West Indians | 0.2 /100 | #274 | Tragic $75,647 |
| Immigrants | Micronesia | 0.2 /100 | #275 | Tragic $75,574 |
| Immigrants | Latin America | 0.2 /100 | #276 | Tragic $75,420 |