Iranian vs Immigrants from Japan Median Household Income
COMPARE
Iranian
Immigrants from Japan
Median Household Income
Median Household Income Comparison
Iranians
Immigrants from Japan
$109,835
MEDIAN HOUSEHOLD INCOME
100.0/ 100
METRIC RATING
7th/ 347
METRIC RANK
$100,711
MEDIAN HOUSEHOLD INCOME
100.0/ 100
METRIC RATING
24th/ 347
METRIC RANK
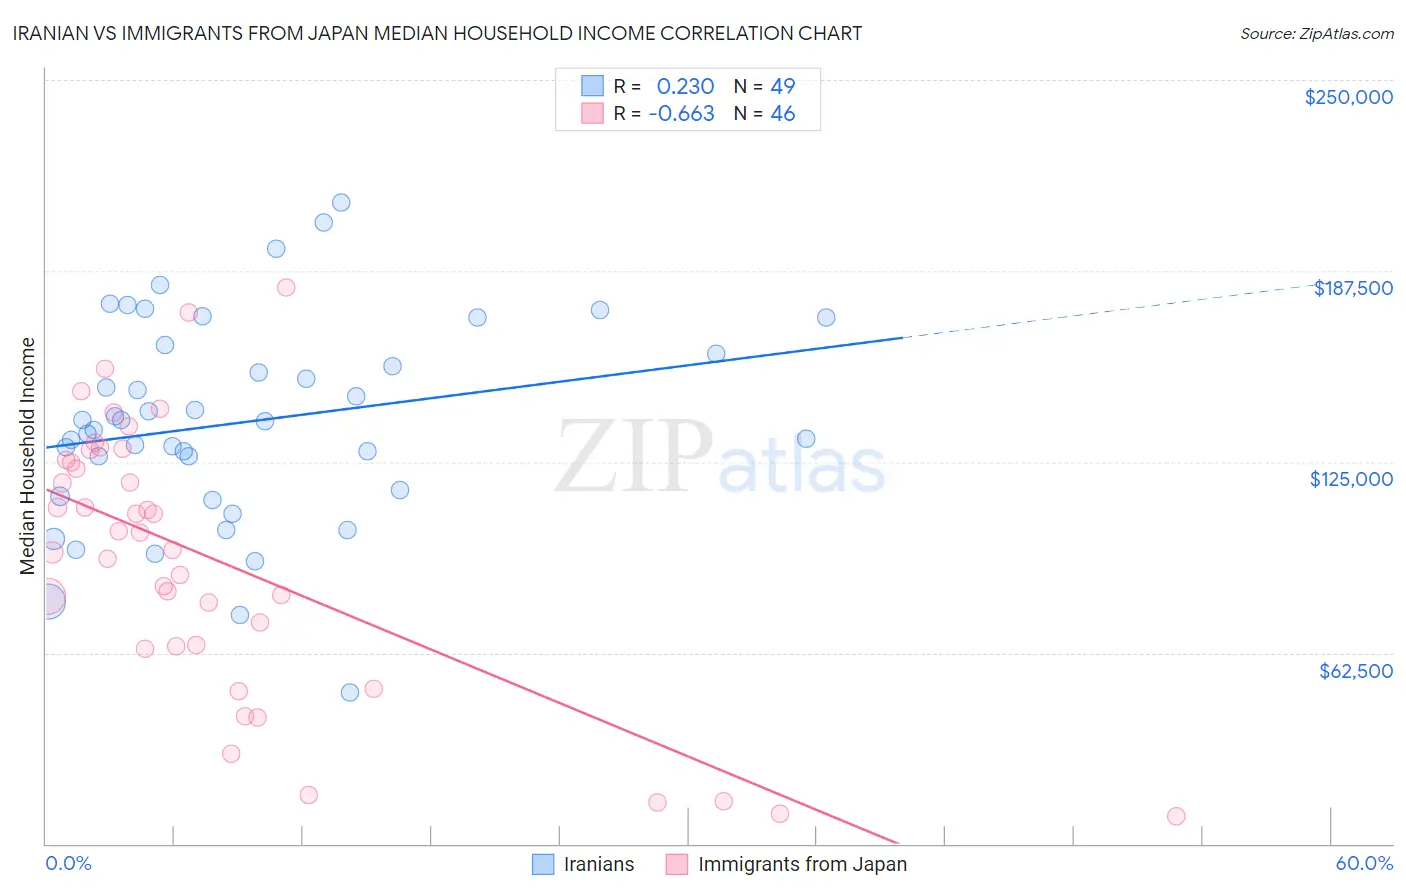
Iranian vs Immigrants from Japan Median Household Income Correlation Chart
The statistical analysis conducted on geographies consisting of 316,594,709 people shows a weak positive correlation between the proportion of Iranians and median household income in the United States with a correlation coefficient (R) of 0.230 and weighted average of $109,835. Similarly, the statistical analysis conducted on geographies consisting of 339,951,010 people shows a significant negative correlation between the proportion of Immigrants from Japan and median household income in the United States with a correlation coefficient (R) of -0.663 and weighted average of $100,711, a difference of 9.1%.
Median Household Income Correlation Summary
| Measurement | Iranian | Immigrants from Japan |
| Minimum | $49,583 | $9,145 |
| Maximum | $210,000 | $182,188 |
| Range | $160,417 | $173,043 |
| Mean | $137,928 | $93,083 |
| Median | $138,452 | $99,144 |
| Interquartile 25% (IQ1) | $114,688 | $64,688 |
| Interquartile 75% (IQ3) | $161,748 | $125,805 |
| Interquartile Range (IQR) | $47,060 | $61,117 |
| Standard Deviation (Sample) | $33,663 | $44,275 |
| Standard Deviation (Population) | $33,318 | $43,791 |
Demographics Similar to Iranians and Immigrants from Japan by Median Household Income
In terms of median household income, the demographic groups most similar to Iranians are Immigrants from Singapore ($110,428, a difference of 0.54%), Thai ($110,648, a difference of 0.74%), Immigrants from Iran ($108,055, a difference of 1.7%), Okinawan ($106,624, a difference of 3.0%), and Immigrants from South Central Asia ($106,057, a difference of 3.6%). Similarly, the demographic groups most similar to Immigrants from Japan are Immigrants from Sweden ($100,699, a difference of 0.010%), Immigrants from Bolivia ($101,394, a difference of 0.68%), Asian ($101,681, a difference of 0.96%), Eastern European ($101,781, a difference of 1.1%), and Bolivian ($102,195, a difference of 1.5%).
| Demographics | Rating | Rank | Median Household Income |
| Thais | 100.0 /100 | #5 | Exceptional $110,648 |
| Immigrants | Singapore | 100.0 /100 | #6 | Exceptional $110,428 |
| Iranians | 100.0 /100 | #7 | Exceptional $109,835 |
| Immigrants | Iran | 100.0 /100 | #8 | Exceptional $108,055 |
| Okinawans | 100.0 /100 | #9 | Exceptional $106,624 |
| Immigrants | South Central Asia | 100.0 /100 | #10 | Exceptional $106,057 |
| Immigrants | China | 100.0 /100 | #11 | Exceptional $105,335 |
| Indians (Asian) | 100.0 /100 | #12 | Exceptional $105,262 |
| Immigrants | Eastern Asia | 100.0 /100 | #13 | Exceptional $104,796 |
| Immigrants | Ireland | 100.0 /100 | #14 | Exceptional $104,692 |
| Immigrants | Israel | 100.0 /100 | #15 | Exceptional $104,090 |
| Burmese | 100.0 /100 | #16 | Exceptional $103,145 |
| Immigrants | Korea | 100.0 /100 | #17 | Exceptional $102,962 |
| Cypriots | 100.0 /100 | #18 | Exceptional $102,843 |
| Immigrants | Australia | 100.0 /100 | #19 | Exceptional $102,562 |
| Bolivians | 100.0 /100 | #20 | Exceptional $102,195 |
| Eastern Europeans | 100.0 /100 | #21 | Exceptional $101,781 |
| Asians | 100.0 /100 | #22 | Exceptional $101,681 |
| Immigrants | Bolivia | 100.0 /100 | #23 | Exceptional $101,394 |
| Immigrants | Japan | 100.0 /100 | #24 | Exceptional $100,711 |
| Immigrants | Sweden | 100.0 /100 | #25 | Exceptional $100,699 |