Polish vs Immigrants from Japan Unemployment Among Ages 16 to 19 years
COMPARE
Polish
Immigrants from Japan
Unemployment Among Ages 16 to 19 years
Unemployment Among Ages 16 to 19 years Comparison
Poles
Immigrants from Japan
16.4%
UNEMPLOYMENT AMONG AGES 16 TO 19 YEARS
99.7/ 100
METRIC RATING
45th/ 347
METRIC RANK
16.6%
UNEMPLOYMENT AMONG AGES 16 TO 19 YEARS
98.9/ 100
METRIC RATING
65th/ 347
METRIC RANK
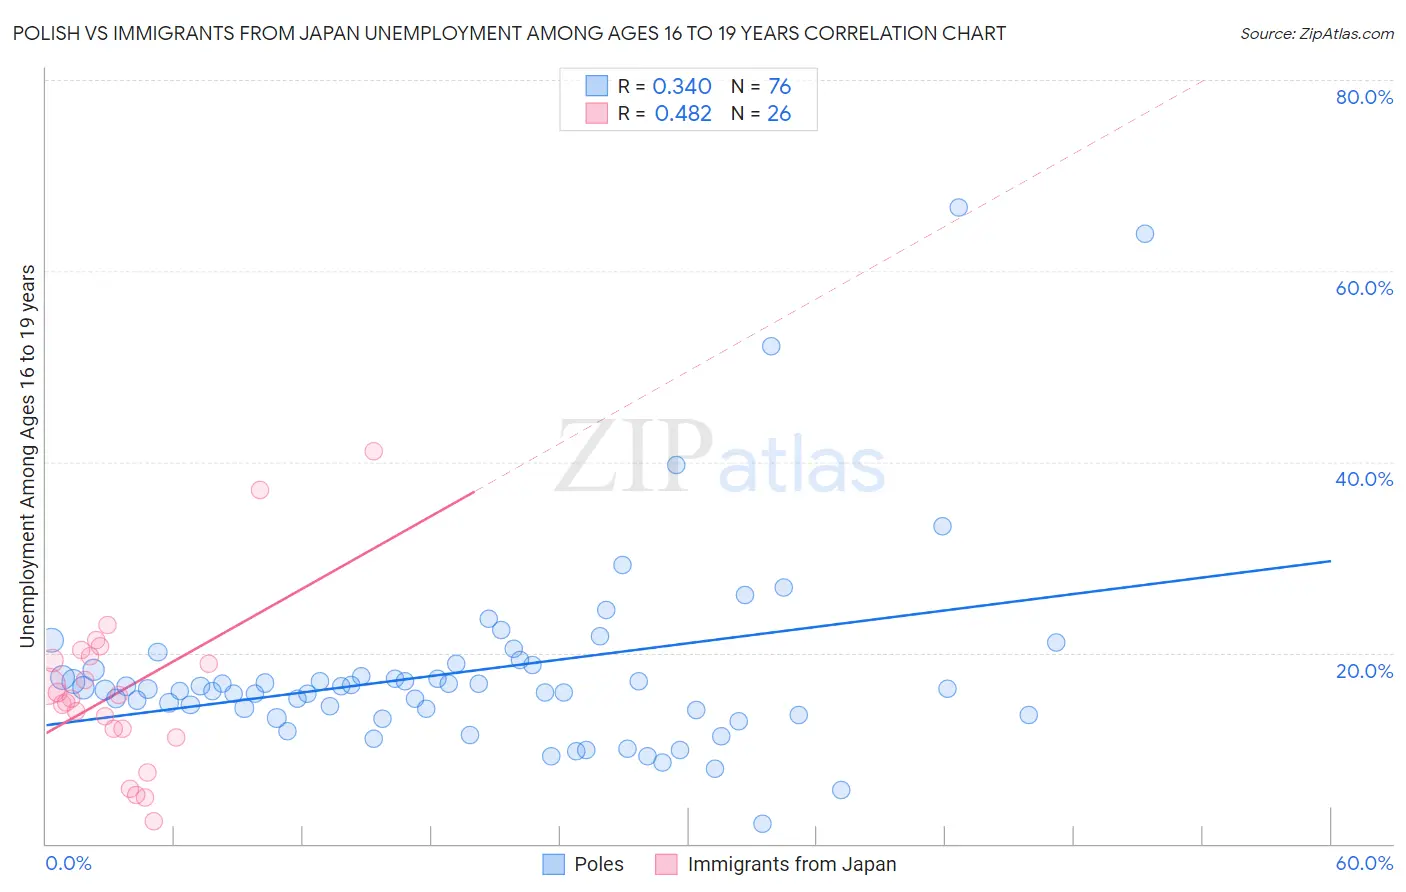
Polish vs Immigrants from Japan Unemployment Among Ages 16 to 19 years Correlation Chart
The statistical analysis conducted on geographies consisting of 501,289,660 people shows a mild positive correlation between the proportion of Poles and unemployment rate among population between the ages 16 and 19 in the United States with a correlation coefficient (R) of 0.340 and weighted average of 16.4%. Similarly, the statistical analysis conducted on geographies consisting of 326,097,714 people shows a moderate positive correlation between the proportion of Immigrants from Japan and unemployment rate among population between the ages 16 and 19 in the United States with a correlation coefficient (R) of 0.482 and weighted average of 16.6%, a difference of 1.7%.
Unemployment Among Ages 16 to 19 years Correlation Summary
| Measurement | Polish | Immigrants from Japan |
| Minimum | 2.1% | 2.4% |
| Maximum | 66.7% | 41.1% |
| Range | 64.6% | 38.7% |
| Mean | 18.1% | 16.1% |
| Median | 16.3% | 15.4% |
| Interquartile 25% (IQ1) | 13.8% | 12.0% |
| Interquartile 75% (IQ3) | 18.5% | 19.6% |
| Interquartile Range (IQR) | 4.7% | 7.6% |
| Standard Deviation (Sample) | 10.5% | 8.7% |
| Standard Deviation (Population) | 10.4% | 8.6% |
Demographics Similar to Poles and Immigrants from Japan by Unemployment Among Ages 16 to 19 years
In terms of unemployment among ages 16 to 19 years, the demographic groups most similar to Poles are Immigrants from North Macedonia (16.4%, a difference of 0.020%), Immigrants from Vietnam (16.4%, a difference of 0.090%), Maltese (16.4%, a difference of 0.14%), Iraqi (16.4%, a difference of 0.21%), and Bhutanese (16.4%, a difference of 0.35%). Similarly, the demographic groups most similar to Immigrants from Japan are Northern European (16.6%, a difference of 0.10%), Scotch-Irish (16.6%, a difference of 0.16%), Macedonian (16.6%, a difference of 0.35%), Immigrants from Cuba (16.6%, a difference of 0.45%), and Menominee (16.6%, a difference of 0.50%).
| Demographics | Rating | Rank | Unemployment Among Ages 16 to 19 years |
| Poles | 99.7 /100 | #45 | Exceptional 16.4% |
| Immigrants | North Macedonia | 99.7 /100 | #46 | Exceptional 16.4% |
| Immigrants | Vietnam | 99.7 /100 | #47 | Exceptional 16.4% |
| Maltese | 99.7 /100 | #48 | Exceptional 16.4% |
| Iraqis | 99.7 /100 | #49 | Exceptional 16.4% |
| Bhutanese | 99.6 /100 | #50 | Exceptional 16.4% |
| Lebanese | 99.6 /100 | #51 | Exceptional 16.4% |
| Welsh | 99.6 /100 | #52 | Exceptional 16.4% |
| Slovenes | 99.6 /100 | #53 | Exceptional 16.4% |
| British | 99.5 /100 | #54 | Exceptional 16.5% |
| Czechoslovakians | 99.5 /100 | #55 | Exceptional 16.5% |
| Sri Lankans | 99.5 /100 | #56 | Exceptional 16.5% |
| Immigrants | Jordan | 99.4 /100 | #57 | Exceptional 16.5% |
| Immigrants | Uganda | 99.4 /100 | #58 | Exceptional 16.5% |
| Irish | 99.4 /100 | #59 | Exceptional 16.5% |
| Menominee | 99.3 /100 | #60 | Exceptional 16.6% |
| Immigrants | Cuba | 99.2 /100 | #61 | Exceptional 16.6% |
| Macedonians | 99.2 /100 | #62 | Exceptional 16.6% |
| Scotch-Irish | 99.1 /100 | #63 | Exceptional 16.6% |
| Northern Europeans | 99.0 /100 | #64 | Exceptional 16.6% |
| Immigrants | Japan | 98.9 /100 | #65 | Exceptional 16.6% |