Polish vs Immigrants from Austria Median Household Income
COMPARE
Polish
Immigrants from Austria
Median Household Income
Median Household Income Comparison
Poles
Immigrants from Austria
$88,472
MEDIAN HOUSEHOLD INCOME
89.7/ 100
METRIC RATING
136th/ 347
METRIC RANK
$95,277
MEDIAN HOUSEHOLD INCOME
99.9/ 100
METRIC RATING
56th/ 347
METRIC RANK
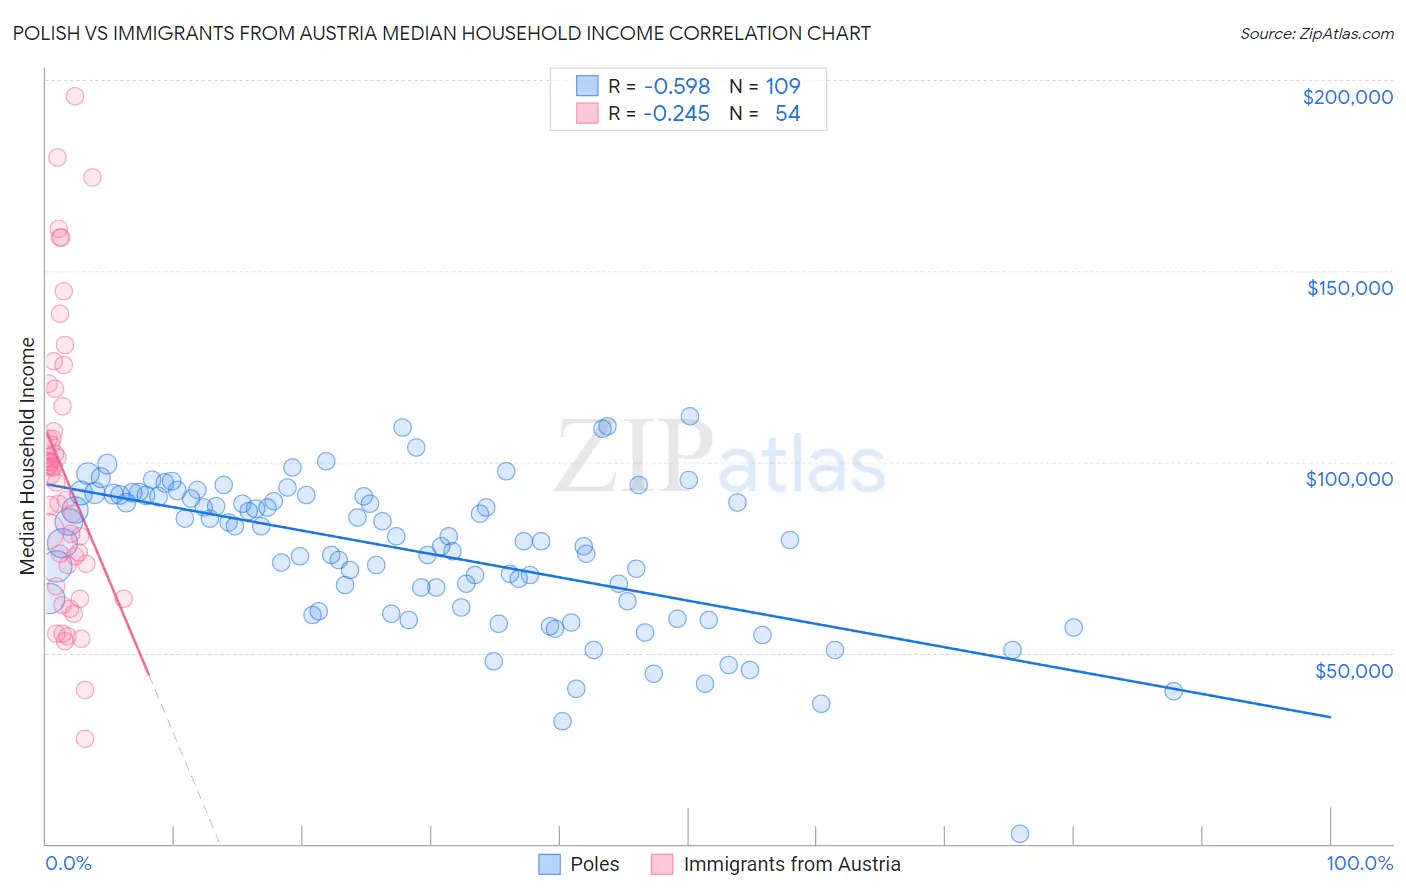
Polish vs Immigrants from Austria Median Household Income Correlation Chart
The statistical analysis conducted on geographies consisting of 559,571,407 people shows a substantial negative correlation between the proportion of Poles and median household income in the United States with a correlation coefficient (R) of -0.598 and weighted average of $88,472. Similarly, the statistical analysis conducted on geographies consisting of 167,955,679 people shows a weak negative correlation between the proportion of Immigrants from Austria and median household income in the United States with a correlation coefficient (R) of -0.245 and weighted average of $95,277, a difference of 7.7%.
Median Household Income Correlation Summary
| Measurement | Polish | Immigrants from Austria |
| Minimum | $2,499 | $27,500 |
| Maximum | $112,083 | $195,784 |
| Range | $109,584 | $168,284 |
| Mean | $76,577 | $97,293 |
| Median | $79,444 | $97,556 |
| Interquartile 25% (IQ1) | $62,696 | $73,089 |
| Interquartile 75% (IQ3) | $91,347 | $114,543 |
| Interquartile Range (IQR) | $28,651 | $41,455 |
| Standard Deviation (Sample) | $19,210 | $36,453 |
| Standard Deviation (Population) | $19,121 | $36,114 |
Similar Demographics by Median Household Income
Demographics Similar to Poles by Median Household Income
In terms of median household income, the demographic groups most similar to Poles are Sierra Leonean ($88,463, a difference of 0.010%), Immigrants from Sierra Leone ($88,498, a difference of 0.030%), Swedish ($88,524, a difference of 0.060%), Arab ($88,398, a difference of 0.080%), and Immigrants from Chile ($88,388, a difference of 0.090%).
| Demographics | Rating | Rank | Median Household Income |
| Brazilians | 92.1 /100 | #129 | Exceptional $88,934 |
| British | 92.0 /100 | #130 | Exceptional $88,914 |
| Immigrants | Syria | 91.4 /100 | #131 | Exceptional $88,792 |
| Europeans | 91.2 /100 | #132 | Exceptional $88,751 |
| Immigrants | Ethiopia | 90.9 /100 | #133 | Exceptional $88,687 |
| Swedes | 90.0 /100 | #134 | Exceptional $88,524 |
| Immigrants | Sierra Leone | 89.9 /100 | #135 | Excellent $88,498 |
| Poles | 89.7 /100 | #136 | Excellent $88,472 |
| Sierra Leoneans | 89.6 /100 | #137 | Excellent $88,463 |
| Arabs | 89.2 /100 | #138 | Excellent $88,398 |
| Immigrants | Chile | 89.2 /100 | #139 | Excellent $88,388 |
| Lebanese | 87.2 /100 | #140 | Excellent $88,091 |
| Immigrants | Morocco | 86.0 /100 | #141 | Excellent $87,930 |
| Canadians | 84.7 /100 | #142 | Excellent $87,769 |
| Danes | 83.9 /100 | #143 | Excellent $87,676 |
Demographics Similar to Immigrants from Austria by Median Household Income
In terms of median household income, the demographic groups most similar to Immigrants from Austria are Immigrants from Czechoslovakia ($95,319, a difference of 0.040%), New Zealander ($95,146, a difference of 0.14%), Soviet Union ($95,098, a difference of 0.19%), Immigrants from Europe ($95,032, a difference of 0.26%), and Korean ($95,018, a difference of 0.27%).
| Demographics | Rating | Rank | Median Household Income |
| Immigrants | Malaysia | 99.9 /100 | #49 | Exceptional $96,292 |
| Bulgarians | 99.9 /100 | #50 | Exceptional $96,290 |
| Estonians | 99.9 /100 | #51 | Exceptional $95,930 |
| Immigrants | South Africa | 99.9 /100 | #52 | Exceptional $95,800 |
| Paraguayans | 99.9 /100 | #53 | Exceptional $95,737 |
| Egyptians | 99.9 /100 | #54 | Exceptional $95,673 |
| Immigrants | Czechoslovakia | 99.9 /100 | #55 | Exceptional $95,319 |
| Immigrants | Austria | 99.9 /100 | #56 | Exceptional $95,277 |
| New Zealanders | 99.8 /100 | #57 | Exceptional $95,146 |
| Soviet Union | 99.8 /100 | #58 | Exceptional $95,098 |
| Immigrants | Europe | 99.8 /100 | #59 | Exceptional $95,032 |
| Koreans | 99.8 /100 | #60 | Exceptional $95,018 |
| Laotians | 99.8 /100 | #61 | Exceptional $94,990 |
| Immigrants | Norway | 99.8 /100 | #62 | Exceptional $94,846 |
| Greeks | 99.8 /100 | #63 | Exceptional $94,735 |