Navajo vs Immigrants from Japan Median Household Income
COMPARE
Navajo
Immigrants from Japan
Median Household Income
Median Household Income Comparison
Navajo
Immigrants from Japan
$59,159
MEDIAN HOUSEHOLD INCOME
0.0/ 100
METRIC RATING
346th/ 347
METRIC RANK
$100,711
MEDIAN HOUSEHOLD INCOME
100.0/ 100
METRIC RATING
24th/ 347
METRIC RANK
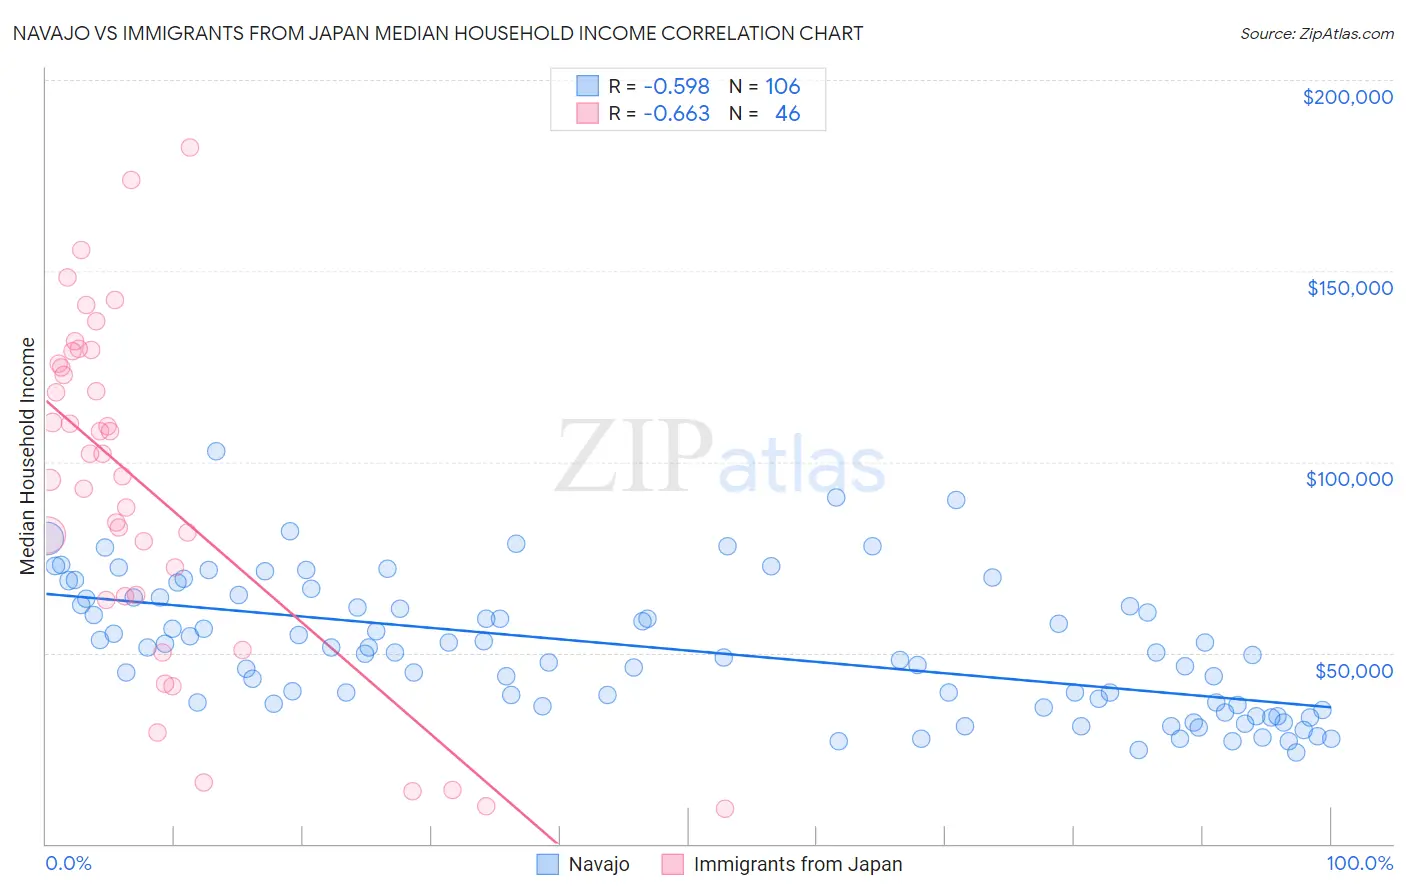
Navajo vs Immigrants from Japan Median Household Income Correlation Chart
The statistical analysis conducted on geographies consisting of 224,715,573 people shows a substantial negative correlation between the proportion of Navajo and median household income in the United States with a correlation coefficient (R) of -0.598 and weighted average of $59,159. Similarly, the statistical analysis conducted on geographies consisting of 339,951,010 people shows a significant negative correlation between the proportion of Immigrants from Japan and median household income in the United States with a correlation coefficient (R) of -0.663 and weighted average of $100,711, a difference of 70.2%.
Median Household Income Correlation Summary
| Measurement | Navajo | Immigrants from Japan |
| Minimum | $24,004 | $9,145 |
| Maximum | $102,885 | $182,188 |
| Range | $78,881 | $173,043 |
| Mean | $51,106 | $93,083 |
| Median | $50,167 | $99,144 |
| Interquartile 25% (IQ1) | $36,185 | $64,688 |
| Interquartile 75% (IQ3) | $64,286 | $125,805 |
| Interquartile Range (IQR) | $28,101 | $61,117 |
| Standard Deviation (Sample) | $17,310 | $44,275 |
| Standard Deviation (Population) | $17,228 | $43,791 |
Similar Demographics by Median Household Income
Demographics Similar to Navajo by Median Household Income
In terms of median household income, the demographic groups most similar to Navajo are Puerto Rican ($59,197, a difference of 0.060%), Tohono O'odham ($61,663, a difference of 4.2%), Houma ($62,575, a difference of 5.8%), Pima ($63,262, a difference of 6.9%), and Crow ($63,681, a difference of 7.6%).
| Demographics | Rating | Rank | Median Household Income |
| Creek | 0.0 /100 | #333 | Tragic $67,715 |
| Blacks/African Americans | 0.0 /100 | #334 | Tragic $67,573 |
| Cheyenne | 0.0 /100 | #335 | Tragic $66,974 |
| Immigrants | Congo | 0.0 /100 | #336 | Tragic $66,768 |
| Kiowa | 0.0 /100 | #337 | Tragic $65,914 |
| Immigrants | Yemen | 0.0 /100 | #338 | Tragic $65,194 |
| Hopi | 0.0 /100 | #339 | Tragic $65,043 |
| Pueblo | 0.0 /100 | #340 | Tragic $64,692 |
| Crow | 0.0 /100 | #341 | Tragic $63,681 |
| Pima | 0.0 /100 | #342 | Tragic $63,262 |
| Houma | 0.0 /100 | #343 | Tragic $62,575 |
| Tohono O'odham | 0.0 /100 | #344 | Tragic $61,663 |
| Puerto Ricans | 0.0 /100 | #345 | Tragic $59,197 |
| Navajo | 0.0 /100 | #346 | Tragic $59,159 |
| Lumbee | 0.0 /100 | #347 | Tragic $54,644 |
Demographics Similar to Immigrants from Japan by Median Household Income
In terms of median household income, the demographic groups most similar to Immigrants from Japan are Immigrants from Sweden ($100,699, a difference of 0.010%), Immigrants from Belgium ($100,306, a difference of 0.40%), Bhutanese ($100,151, a difference of 0.56%), Immigrants from Bolivia ($101,394, a difference of 0.68%), and Immigrants from Sri Lanka ($99,943, a difference of 0.77%).
| Demographics | Rating | Rank | Median Household Income |
| Immigrants | Korea | 100.0 /100 | #17 | Exceptional $102,962 |
| Cypriots | 100.0 /100 | #18 | Exceptional $102,843 |
| Immigrants | Australia | 100.0 /100 | #19 | Exceptional $102,562 |
| Bolivians | 100.0 /100 | #20 | Exceptional $102,195 |
| Eastern Europeans | 100.0 /100 | #21 | Exceptional $101,781 |
| Asians | 100.0 /100 | #22 | Exceptional $101,681 |
| Immigrants | Bolivia | 100.0 /100 | #23 | Exceptional $101,394 |
| Immigrants | Japan | 100.0 /100 | #24 | Exceptional $100,711 |
| Immigrants | Sweden | 100.0 /100 | #25 | Exceptional $100,699 |
| Immigrants | Belgium | 100.0 /100 | #26 | Exceptional $100,306 |
| Bhutanese | 100.0 /100 | #27 | Exceptional $100,151 |
| Immigrants | Sri Lanka | 100.0 /100 | #28 | Exceptional $99,943 |
| Immigrants | Asia | 100.0 /100 | #29 | Exceptional $99,933 |
| Immigrants | Northern Europe | 100.0 /100 | #30 | Exceptional $99,813 |
| Turks | 100.0 /100 | #31 | Exceptional $99,389 |