Ottawa vs Immigrants from Somalia Median Family Income
COMPARE
Ottawa
Immigrants from Somalia
Median Family Income
Median Family Income Comparison
Ottawa
Immigrants from Somalia
$86,380
MEDIAN FAMILY INCOME
0.0/ 100
METRIC RATING
300th/ 347
METRIC RANK
$92,609
MEDIAN FAMILY INCOME
0.6/ 100
METRIC RATING
251st/ 347
METRIC RANK
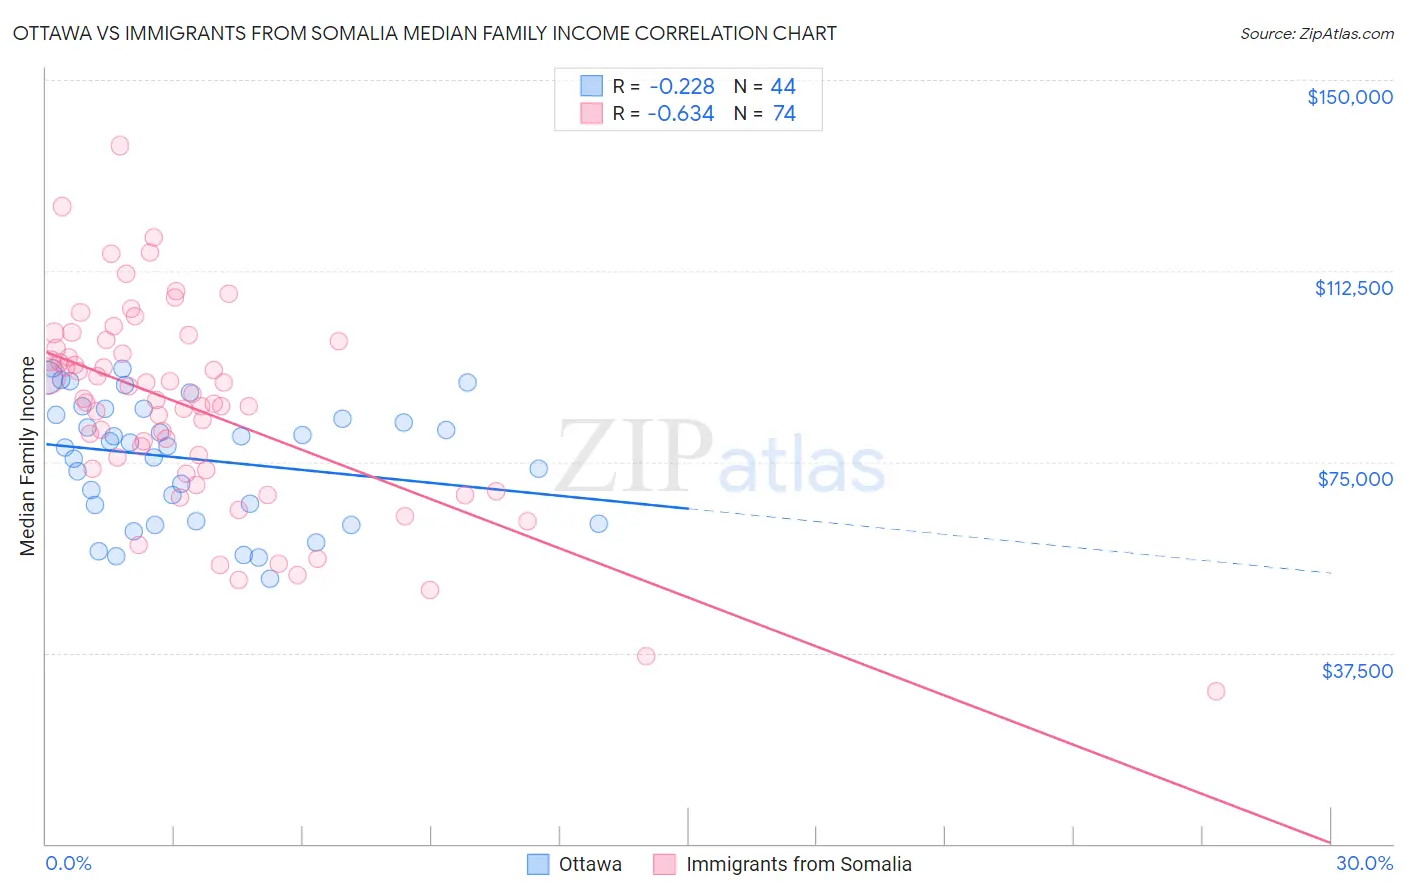
Ottawa vs Immigrants from Somalia Median Family Income Correlation Chart
The statistical analysis conducted on geographies consisting of 49,943,189 people shows a weak negative correlation between the proportion of Ottawa and median family income in the United States with a correlation coefficient (R) of -0.228 and weighted average of $86,380. Similarly, the statistical analysis conducted on geographies consisting of 92,093,839 people shows a significant negative correlation between the proportion of Immigrants from Somalia and median family income in the United States with a correlation coefficient (R) of -0.634 and weighted average of $92,609, a difference of 7.2%.
Median Family Income Correlation Summary
| Measurement | Ottawa | Immigrants from Somalia |
| Minimum | $52,125 | $29,978 |
| Maximum | $93,380 | $137,115 |
| Range | $41,255 | $107,137 |
| Mean | $75,597 | $85,390 |
| Median | $78,416 | $86,897 |
| Interquartile 25% (IQ1) | $64,972 | $73,310 |
| Interquartile 75% (IQ3) | $84,864 | $97,167 |
| Interquartile Range (IQR) | $19,892 | $23,857 |
| Standard Deviation (Sample) | $11,825 | $19,854 |
| Standard Deviation (Population) | $11,690 | $19,720 |
Similar Demographics by Median Family Income
Demographics Similar to Ottawa by Median Family Income
In terms of median family income, the demographic groups most similar to Ottawa are Chippewa ($86,852, a difference of 0.55%), Colville ($85,792, a difference of 0.69%), Immigrants from Latin America ($86,989, a difference of 0.71%), Spanish American Indian ($85,728, a difference of 0.76%), and Hispanic or Latino ($85,647, a difference of 0.86%).
| Demographics | Rating | Rank | Median Family Income |
| Ute | 0.0 /100 | #293 | Tragic $87,596 |
| Fijians | 0.0 /100 | #294 | Tragic $87,387 |
| Yaqui | 0.0 /100 | #295 | Tragic $87,289 |
| Immigrants | Guatemala | 0.0 /100 | #296 | Tragic $87,191 |
| Cajuns | 0.0 /100 | #297 | Tragic $87,157 |
| Immigrants | Latin America | 0.0 /100 | #298 | Tragic $86,989 |
| Chippewa | 0.0 /100 | #299 | Tragic $86,852 |
| Ottawa | 0.0 /100 | #300 | Tragic $86,380 |
| Colville | 0.0 /100 | #301 | Tragic $85,792 |
| Spanish American Indians | 0.0 /100 | #302 | Tragic $85,728 |
| Hispanics or Latinos | 0.0 /100 | #303 | Tragic $85,647 |
| Mexicans | 0.0 /100 | #304 | Tragic $85,618 |
| Paiute | 0.0 /100 | #305 | Tragic $85,414 |
| Immigrants | Dominica | 0.0 /100 | #306 | Tragic $85,411 |
| Chickasaw | 0.0 /100 | #307 | Tragic $85,356 |
Demographics Similar to Immigrants from Somalia by Median Family Income
In terms of median family income, the demographic groups most similar to Immigrants from Somalia are Immigrants from El Salvador ($92,545, a difference of 0.070%), Immigrants from Guyana ($92,513, a difference of 0.10%), West Indian ($92,765, a difference of 0.17%), Immigrants from Barbados ($92,419, a difference of 0.21%), and Immigrants from Ecuador ($92,837, a difference of 0.25%).
| Demographics | Rating | Rank | Median Family Income |
| Sub-Saharan Africans | 1.0 /100 | #244 | Tragic $93,748 |
| Immigrants | Middle Africa | 1.0 /100 | #245 | Tragic $93,593 |
| Guyanese | 0.9 /100 | #246 | Tragic $93,373 |
| Immigrants | Senegal | 0.7 /100 | #247 | Tragic $92,912 |
| French American Indians | 0.7 /100 | #248 | Tragic $92,872 |
| Immigrants | Ecuador | 0.7 /100 | #249 | Tragic $92,837 |
| West Indians | 0.6 /100 | #250 | Tragic $92,765 |
| Immigrants | Somalia | 0.6 /100 | #251 | Tragic $92,609 |
| Immigrants | El Salvador | 0.6 /100 | #252 | Tragic $92,545 |
| Immigrants | Guyana | 0.6 /100 | #253 | Tragic $92,513 |
| Immigrants | Barbados | 0.5 /100 | #254 | Tragic $92,419 |
| Immigrants | Laos | 0.5 /100 | #255 | Tragic $92,239 |
| Nicaraguans | 0.5 /100 | #256 | Tragic $92,231 |
| Americans | 0.4 /100 | #257 | Tragic $92,096 |
| Osage | 0.4 /100 | #258 | Tragic $91,926 |