Ottawa vs Immigrants from Sudan Median Family Income
COMPARE
Ottawa
Immigrants from Sudan
Median Family Income
Median Family Income Comparison
Ottawa
Immigrants from Sudan
$86,380
MEDIAN FAMILY INCOME
0.0/ 100
METRIC RATING
300th/ 347
METRIC RANK
$97,737
MEDIAN FAMILY INCOME
7.4/ 100
METRIC RATING
211th/ 347
METRIC RANK
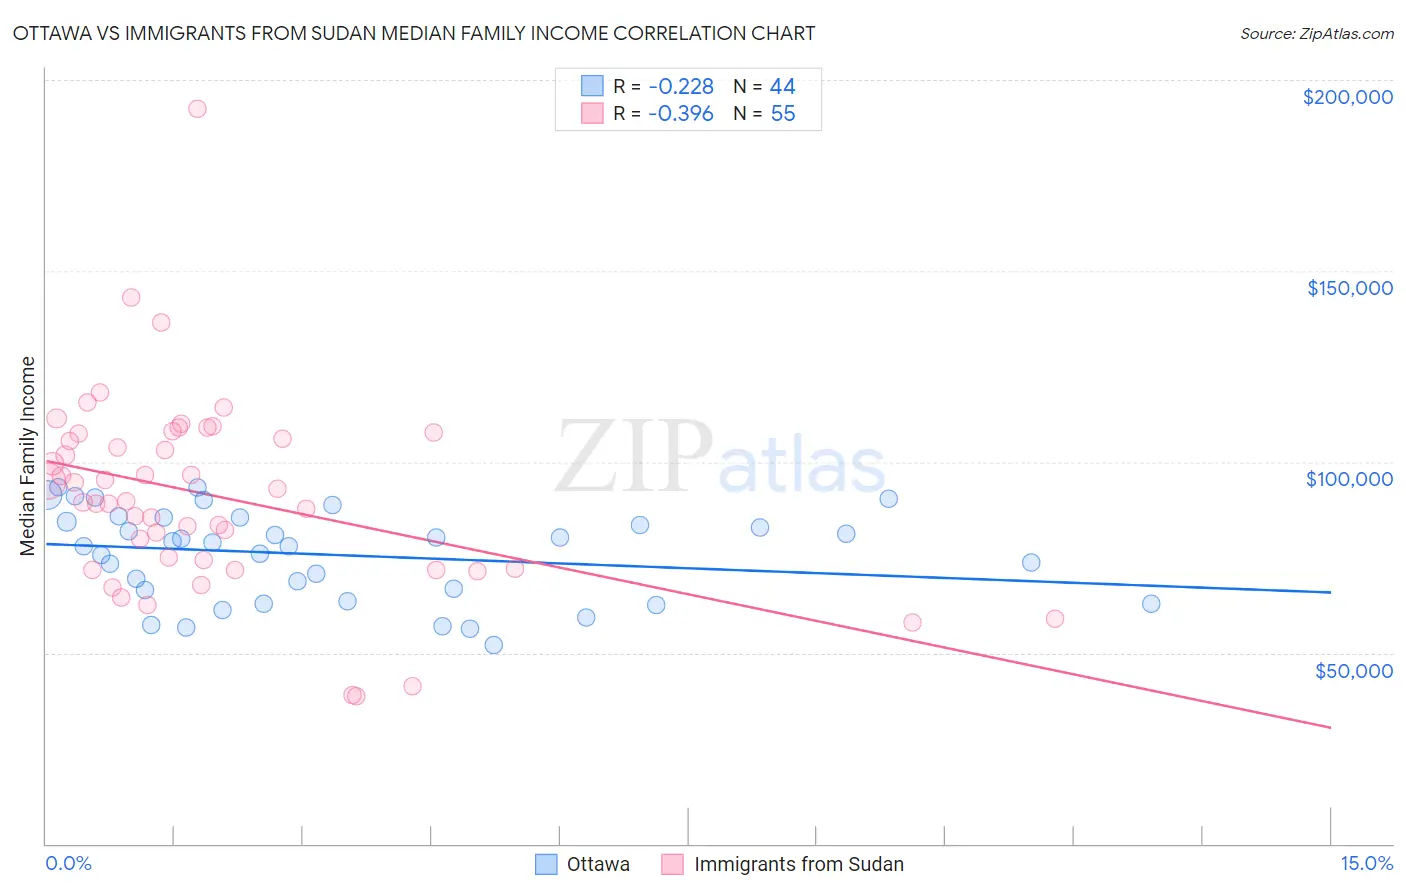
Ottawa vs Immigrants from Sudan Median Family Income Correlation Chart
The statistical analysis conducted on geographies consisting of 49,943,189 people shows a weak negative correlation between the proportion of Ottawa and median family income in the United States with a correlation coefficient (R) of -0.228 and weighted average of $86,380. Similarly, the statistical analysis conducted on geographies consisting of 118,933,940 people shows a mild negative correlation between the proportion of Immigrants from Sudan and median family income in the United States with a correlation coefficient (R) of -0.396 and weighted average of $97,737, a difference of 13.2%.
Median Family Income Correlation Summary
| Measurement | Ottawa | Immigrants from Sudan |
| Minimum | $52,125 | $38,705 |
| Maximum | $93,380 | $192,500 |
| Range | $41,255 | $153,795 |
| Mean | $75,597 | $91,079 |
| Median | $78,416 | $89,618 |
| Interquartile 25% (IQ1) | $64,972 | $71,964 |
| Interquartile 75% (IQ3) | $84,864 | $107,289 |
| Interquartile Range (IQR) | $19,892 | $35,325 |
| Standard Deviation (Sample) | $11,825 | $25,898 |
| Standard Deviation (Population) | $11,690 | $25,661 |
Similar Demographics by Median Family Income
Demographics Similar to Ottawa by Median Family Income
In terms of median family income, the demographic groups most similar to Ottawa are Chippewa ($86,852, a difference of 0.55%), Colville ($85,792, a difference of 0.69%), Immigrants from Latin America ($86,989, a difference of 0.71%), Spanish American Indian ($85,728, a difference of 0.76%), and Hispanic or Latino ($85,647, a difference of 0.86%).
| Demographics | Rating | Rank | Median Family Income |
| Ute | 0.0 /100 | #293 | Tragic $87,596 |
| Fijians | 0.0 /100 | #294 | Tragic $87,387 |
| Yaqui | 0.0 /100 | #295 | Tragic $87,289 |
| Immigrants | Guatemala | 0.0 /100 | #296 | Tragic $87,191 |
| Cajuns | 0.0 /100 | #297 | Tragic $87,157 |
| Immigrants | Latin America | 0.0 /100 | #298 | Tragic $86,989 |
| Chippewa | 0.0 /100 | #299 | Tragic $86,852 |
| Ottawa | 0.0 /100 | #300 | Tragic $86,380 |
| Colville | 0.0 /100 | #301 | Tragic $85,792 |
| Spanish American Indians | 0.0 /100 | #302 | Tragic $85,728 |
| Hispanics or Latinos | 0.0 /100 | #303 | Tragic $85,647 |
| Mexicans | 0.0 /100 | #304 | Tragic $85,618 |
| Paiute | 0.0 /100 | #305 | Tragic $85,414 |
| Immigrants | Dominica | 0.0 /100 | #306 | Tragic $85,411 |
| Chickasaw | 0.0 /100 | #307 | Tragic $85,356 |
Demographics Similar to Immigrants from Sudan by Median Family Income
In terms of median family income, the demographic groups most similar to Immigrants from Sudan are Panamanian ($97,683, a difference of 0.050%), Immigrants from Armenia ($97,605, a difference of 0.13%), Bermudan ($97,577, a difference of 0.16%), Nigerian ($97,522, a difference of 0.22%), and Puget Sound Salish ($97,958, a difference of 0.23%).
| Demographics | Rating | Rank | Median Family Income |
| Ghanaians | 12.6 /100 | #204 | Poor $98,877 |
| Hawaiians | 12.5 /100 | #205 | Poor $98,869 |
| Immigrants | Iraq | 12.1 /100 | #206 | Poor $98,786 |
| Aleuts | 11.6 /100 | #207 | Poor $98,702 |
| Immigrants | Uruguay | 9.2 /100 | #208 | Tragic $98,205 |
| Immigrants | Colombia | 8.7 /100 | #209 | Tragic $98,067 |
| Puget Sound Salish | 8.2 /100 | #210 | Tragic $97,958 |
| Immigrants | Sudan | 7.4 /100 | #211 | Tragic $97,737 |
| Panamanians | 7.2 /100 | #212 | Tragic $97,683 |
| Immigrants | Armenia | 7.0 /100 | #213 | Tragic $97,605 |
| Bermudans | 6.9 /100 | #214 | Tragic $97,577 |
| Nigerians | 6.7 /100 | #215 | Tragic $97,522 |
| Immigrants | Bosnia and Herzegovina | 6.4 /100 | #216 | Tragic $97,432 |
| Japanese | 6.0 /100 | #217 | Tragic $97,288 |
| Immigrants | Cambodia | 5.8 /100 | #218 | Tragic $97,222 |