Immigrants from Philippines vs Immigrants from Somalia Median Family Income
COMPARE
Immigrants from Philippines
Immigrants from Somalia
Median Family Income
Median Family Income Comparison
Immigrants from Philippines
Immigrants from Somalia
$108,288
MEDIAN FAMILY INCOME
94.6/ 100
METRIC RATING
117th/ 347
METRIC RANK
$92,609
MEDIAN FAMILY INCOME
0.6/ 100
METRIC RATING
251st/ 347
METRIC RANK
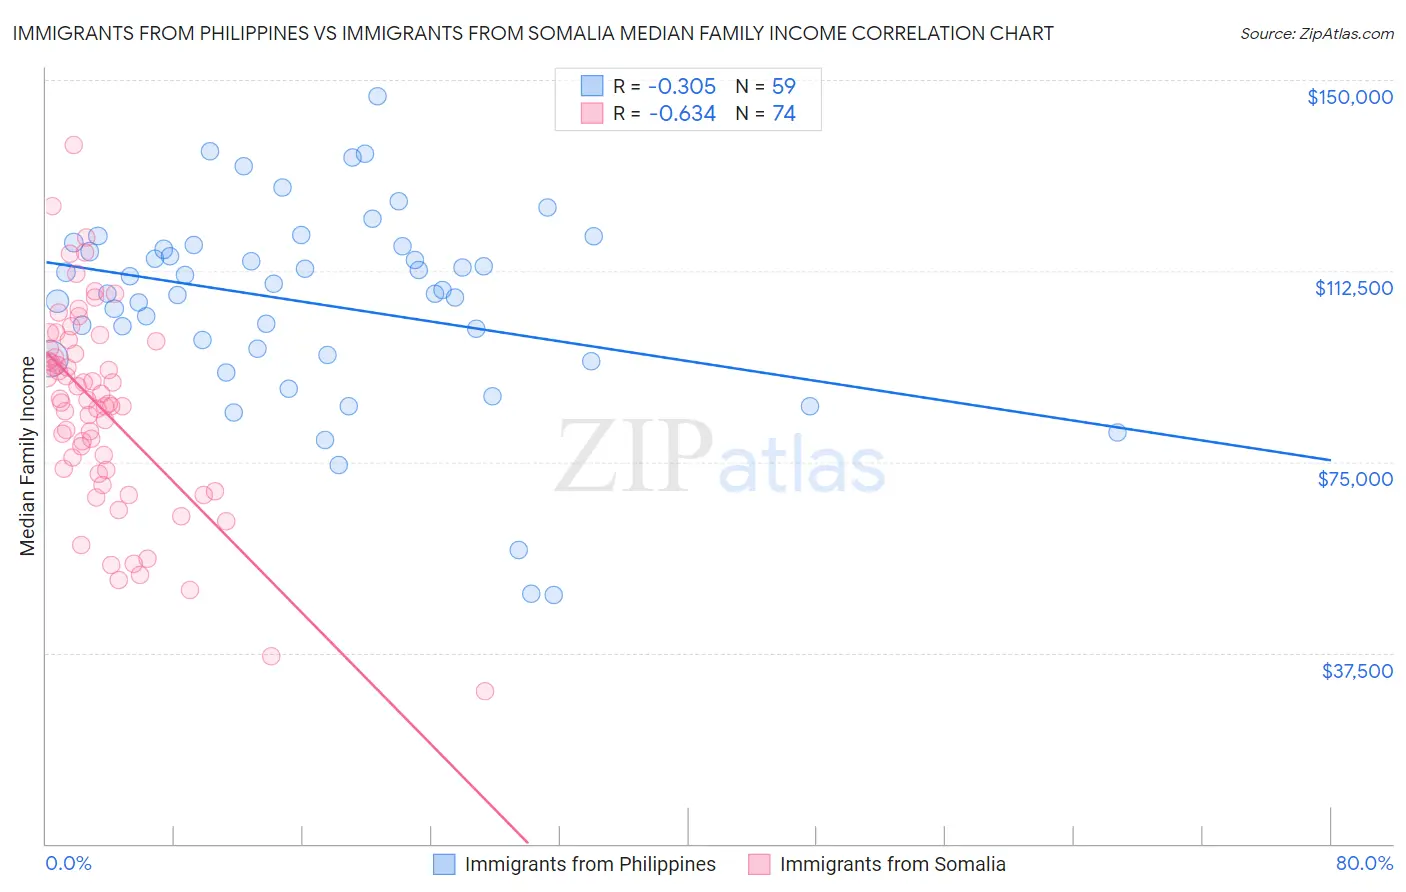
Immigrants from Philippines vs Immigrants from Somalia Median Family Income Correlation Chart
The statistical analysis conducted on geographies consisting of 470,858,648 people shows a mild negative correlation between the proportion of Immigrants from Philippines and median family income in the United States with a correlation coefficient (R) of -0.305 and weighted average of $108,288. Similarly, the statistical analysis conducted on geographies consisting of 92,093,839 people shows a significant negative correlation between the proportion of Immigrants from Somalia and median family income in the United States with a correlation coefficient (R) of -0.634 and weighted average of $92,609, a difference of 16.9%.
Median Family Income Correlation Summary
| Measurement | Immigrants from Philippines | Immigrants from Somalia |
| Minimum | $48,750 | $29,978 |
| Maximum | $146,906 | $137,115 |
| Range | $98,156 | $107,137 |
| Mean | $106,076 | $85,390 |
| Median | $108,731 | $86,897 |
| Interquartile 25% (IQ1) | $96,071 | $73,310 |
| Interquartile 75% (IQ3) | $117,321 | $97,167 |
| Interquartile Range (IQR) | $21,250 | $23,857 |
| Standard Deviation (Sample) | $19,555 | $19,854 |
| Standard Deviation (Population) | $19,389 | $19,720 |
Similar Demographics by Median Family Income
Demographics Similar to Immigrants from Philippines by Median Family Income
In terms of median family income, the demographic groups most similar to Immigrants from Philippines are Ethiopian ($108,251, a difference of 0.030%), Sri Lankan ($108,234, a difference of 0.050%), Immigrants from Northern Africa ($108,161, a difference of 0.12%), Chilean ($108,429, a difference of 0.13%), and European ($108,099, a difference of 0.18%).
| Demographics | Rating | Rank | Median Family Income |
| British | 95.6 /100 | #110 | Exceptional $108,705 |
| Immigrants | Western Asia | 95.6 /100 | #111 | Exceptional $108,691 |
| Immigrants | Poland | 95.3 /100 | #112 | Exceptional $108,570 |
| Immigrants | Saudi Arabia | 95.2 /100 | #113 | Exceptional $108,544 |
| Poles | 95.2 /100 | #114 | Exceptional $108,507 |
| Swedes | 95.1 /100 | #115 | Exceptional $108,499 |
| Chileans | 95.0 /100 | #116 | Exceptional $108,429 |
| Immigrants | Philippines | 94.6 /100 | #117 | Exceptional $108,288 |
| Ethiopians | 94.5 /100 | #118 | Exceptional $108,251 |
| Sri Lankans | 94.5 /100 | #119 | Exceptional $108,234 |
| Immigrants | Northern Africa | 94.3 /100 | #120 | Exceptional $108,161 |
| Europeans | 94.1 /100 | #121 | Exceptional $108,099 |
| Immigrants | Jordan | 92.9 /100 | #122 | Exceptional $107,715 |
| Carpatho Rusyns | 92.2 /100 | #123 | Exceptional $107,502 |
| Pakistanis | 91.7 /100 | #124 | Exceptional $107,390 |
Demographics Similar to Immigrants from Somalia by Median Family Income
In terms of median family income, the demographic groups most similar to Immigrants from Somalia are Immigrants from El Salvador ($92,545, a difference of 0.070%), Immigrants from Guyana ($92,513, a difference of 0.10%), West Indian ($92,765, a difference of 0.17%), Immigrants from Barbados ($92,419, a difference of 0.21%), and Immigrants from Ecuador ($92,837, a difference of 0.25%).
| Demographics | Rating | Rank | Median Family Income |
| Sub-Saharan Africans | 1.0 /100 | #244 | Tragic $93,748 |
| Immigrants | Middle Africa | 1.0 /100 | #245 | Tragic $93,593 |
| Guyanese | 0.9 /100 | #246 | Tragic $93,373 |
| Immigrants | Senegal | 0.7 /100 | #247 | Tragic $92,912 |
| French American Indians | 0.7 /100 | #248 | Tragic $92,872 |
| Immigrants | Ecuador | 0.7 /100 | #249 | Tragic $92,837 |
| West Indians | 0.6 /100 | #250 | Tragic $92,765 |
| Immigrants | Somalia | 0.6 /100 | #251 | Tragic $92,609 |
| Immigrants | El Salvador | 0.6 /100 | #252 | Tragic $92,545 |
| Immigrants | Guyana | 0.6 /100 | #253 | Tragic $92,513 |
| Immigrants | Barbados | 0.5 /100 | #254 | Tragic $92,419 |
| Immigrants | Laos | 0.5 /100 | #255 | Tragic $92,239 |
| Nicaraguans | 0.5 /100 | #256 | Tragic $92,231 |
| Americans | 0.4 /100 | #257 | Tragic $92,096 |
| Osage | 0.4 /100 | #258 | Tragic $91,926 |