Ottawa vs Immigrants from Somalia Median Household Income
COMPARE
Ottawa
Immigrants from Somalia
Median Household Income
Median Household Income Comparison
Ottawa
Immigrants from Somalia
$70,984
MEDIAN HOUSEHOLD INCOME
0.0/ 100
METRIC RATING
315th/ 347
METRIC RANK
$74,300
MEDIAN HOUSEHOLD INCOME
0.1/ 100
METRIC RATING
286th/ 347
METRIC RANK
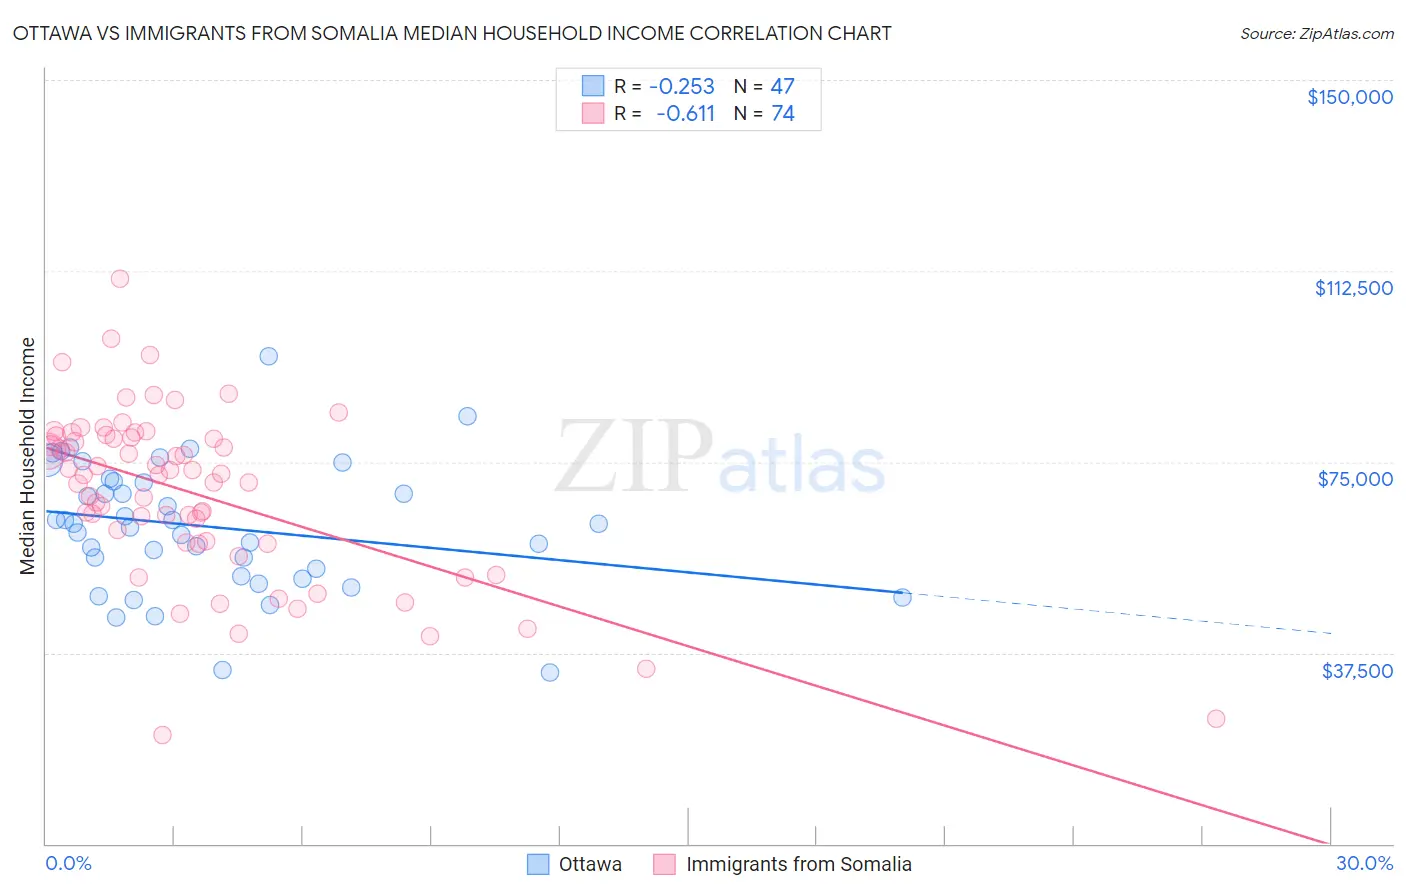
Ottawa vs Immigrants from Somalia Median Household Income Correlation Chart
The statistical analysis conducted on geographies consisting of 49,944,469 people shows a weak negative correlation between the proportion of Ottawa and median household income in the United States with a correlation coefficient (R) of -0.253 and weighted average of $70,984. Similarly, the statistical analysis conducted on geographies consisting of 92,093,487 people shows a significant negative correlation between the proportion of Immigrants from Somalia and median household income in the United States with a correlation coefficient (R) of -0.611 and weighted average of $74,300, a difference of 4.7%.
Median Household Income Correlation Summary
| Measurement | Ottawa | Immigrants from Somalia |
| Minimum | $33,750 | $21,288 |
| Maximum | $95,750 | $111,048 |
| Range | $62,000 | $89,760 |
| Mean | $62,197 | $68,739 |
| Median | $62,810 | $72,392 |
| Interquartile 25% (IQ1) | $52,443 | $59,132 |
| Interquartile 75% (IQ3) | $71,315 | $79,747 |
| Interquartile Range (IQR) | $18,872 | $20,615 |
| Standard Deviation (Sample) | $12,658 | $16,683 |
| Standard Deviation (Population) | $12,523 | $16,570 |
Similar Demographics by Median Household Income
Demographics Similar to Ottawa by Median Household Income
In terms of median household income, the demographic groups most similar to Ottawa are Apache ($70,927, a difference of 0.080%), Dominican ($71,302, a difference of 0.45%), Immigrants from Bahamas ($71,349, a difference of 0.51%), Cajun ($70,605, a difference of 0.54%), and Chippewa ($70,539, a difference of 0.63%).
| Demographics | Rating | Rank | Median Household Income |
| Yakama | 0.0 /100 | #308 | Tragic $72,225 |
| Immigrants | Caribbean | 0.0 /100 | #309 | Tragic $71,860 |
| U.S. Virgin Islanders | 0.0 /100 | #310 | Tragic $71,853 |
| Immigrants | Zaire | 0.0 /100 | #311 | Tragic $71,801 |
| Immigrants | Honduras | 0.0 /100 | #312 | Tragic $71,452 |
| Immigrants | Bahamas | 0.0 /100 | #313 | Tragic $71,349 |
| Dominicans | 0.0 /100 | #314 | Tragic $71,302 |
| Ottawa | 0.0 /100 | #315 | Tragic $70,984 |
| Apache | 0.0 /100 | #316 | Tragic $70,927 |
| Cajuns | 0.0 /100 | #317 | Tragic $70,605 |
| Chippewa | 0.0 /100 | #318 | Tragic $70,539 |
| Immigrants | Dominican Republic | 0.0 /100 | #319 | Tragic $70,208 |
| Colville | 0.0 /100 | #320 | Tragic $70,094 |
| Chickasaw | 0.0 /100 | #321 | Tragic $70,005 |
| Choctaw | 0.0 /100 | #322 | Tragic $69,947 |
Demographics Similar to Immigrants from Somalia by Median Household Income
In terms of median household income, the demographic groups most similar to Immigrants from Somalia are Iroquois ($74,279, a difference of 0.030%), Immigrants from Central America ($74,217, a difference of 0.11%), Mexican ($74,399, a difference of 0.13%), Fijian ($74,205, a difference of 0.13%), and Bangladeshi ($74,112, a difference of 0.25%).
| Demographics | Rating | Rank | Median Household Income |
| Immigrants | Guatemala | 0.2 /100 | #279 | Tragic $75,123 |
| Senegalese | 0.2 /100 | #280 | Tragic $74,999 |
| Immigrants | Liberia | 0.1 /100 | #281 | Tragic $74,896 |
| Central American Indians | 0.1 /100 | #282 | Tragic $74,847 |
| Cree | 0.1 /100 | #283 | Tragic $74,685 |
| Yaqui | 0.1 /100 | #284 | Tragic $74,596 |
| Mexicans | 0.1 /100 | #285 | Tragic $74,399 |
| Immigrants | Somalia | 0.1 /100 | #286 | Tragic $74,300 |
| Iroquois | 0.1 /100 | #287 | Tragic $74,279 |
| Immigrants | Central America | 0.1 /100 | #288 | Tragic $74,217 |
| Fijians | 0.1 /100 | #289 | Tragic $74,205 |
| Bangladeshis | 0.1 /100 | #290 | Tragic $74,112 |
| Hispanics or Latinos | 0.1 /100 | #291 | Tragic $73,823 |
| Comanche | 0.1 /100 | #292 | Tragic $73,747 |
| Immigrants | Cabo Verde | 0.1 /100 | #293 | Tragic $73,515 |