Ottawa vs Czechoslovakian Median Family Income
COMPARE
Ottawa
Czechoslovakian
Median Family Income
Median Family Income Comparison
Ottawa
Czechoslovakians
$86,380
MEDIAN FAMILY INCOME
0.0/ 100
METRIC RATING
300th/ 347
METRIC RANK
$103,273
MEDIAN FAMILY INCOME
57.6/ 100
METRIC RATING
169th/ 347
METRIC RANK
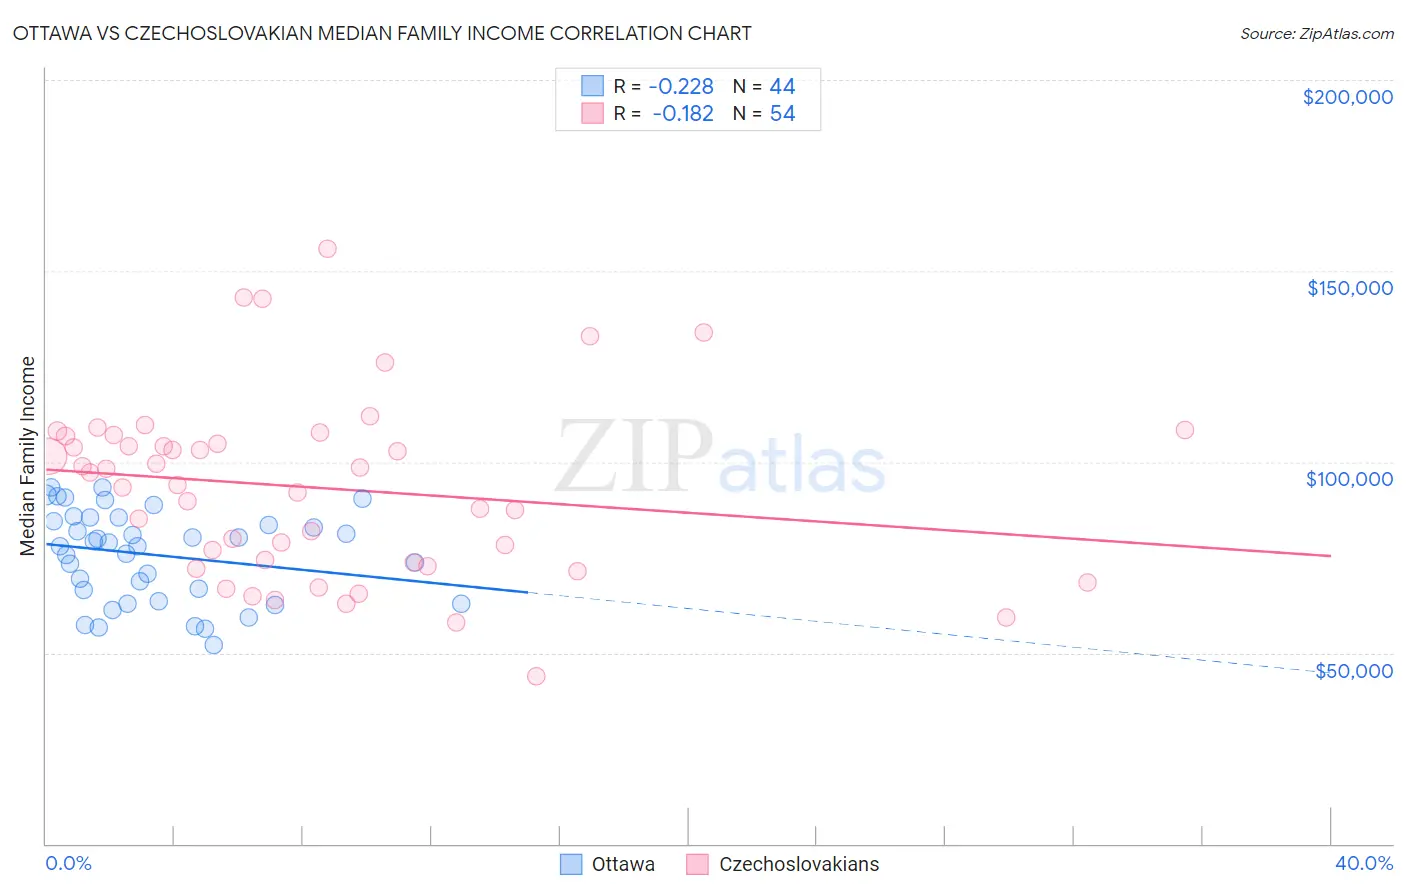
Ottawa vs Czechoslovakian Median Family Income Correlation Chart
The statistical analysis conducted on geographies consisting of 49,943,189 people shows a weak negative correlation between the proportion of Ottawa and median family income in the United States with a correlation coefficient (R) of -0.228 and weighted average of $86,380. Similarly, the statistical analysis conducted on geographies consisting of 368,451,092 people shows a poor negative correlation between the proportion of Czechoslovakians and median family income in the United States with a correlation coefficient (R) of -0.182 and weighted average of $103,273, a difference of 19.6%.
Median Family Income Correlation Summary
| Measurement | Ottawa | Czechoslovakian |
| Minimum | $52,125 | $43,750 |
| Maximum | $93,380 | $155,917 |
| Range | $41,255 | $112,167 |
| Mean | $75,597 | $93,173 |
| Median | $78,416 | $95,488 |
| Interquartile 25% (IQ1) | $64,972 | $73,511 |
| Interquartile 75% (IQ3) | $84,864 | $106,731 |
| Interquartile Range (IQR) | $19,892 | $33,220 |
| Standard Deviation (Sample) | $11,825 | $23,604 |
| Standard Deviation (Population) | $11,690 | $23,385 |
Similar Demographics by Median Family Income
Demographics Similar to Ottawa by Median Family Income
In terms of median family income, the demographic groups most similar to Ottawa are Chippewa ($86,852, a difference of 0.55%), Colville ($85,792, a difference of 0.69%), Immigrants from Latin America ($86,989, a difference of 0.71%), Spanish American Indian ($85,728, a difference of 0.76%), and Hispanic or Latino ($85,647, a difference of 0.86%).
| Demographics | Rating | Rank | Median Family Income |
| Ute | 0.0 /100 | #293 | Tragic $87,596 |
| Fijians | 0.0 /100 | #294 | Tragic $87,387 |
| Yaqui | 0.0 /100 | #295 | Tragic $87,289 |
| Immigrants | Guatemala | 0.0 /100 | #296 | Tragic $87,191 |
| Cajuns | 0.0 /100 | #297 | Tragic $87,157 |
| Immigrants | Latin America | 0.0 /100 | #298 | Tragic $86,989 |
| Chippewa | 0.0 /100 | #299 | Tragic $86,852 |
| Ottawa | 0.0 /100 | #300 | Tragic $86,380 |
| Colville | 0.0 /100 | #301 | Tragic $85,792 |
| Spanish American Indians | 0.0 /100 | #302 | Tragic $85,728 |
| Hispanics or Latinos | 0.0 /100 | #303 | Tragic $85,647 |
| Mexicans | 0.0 /100 | #304 | Tragic $85,618 |
| Paiute | 0.0 /100 | #305 | Tragic $85,414 |
| Immigrants | Dominica | 0.0 /100 | #306 | Tragic $85,411 |
| Chickasaw | 0.0 /100 | #307 | Tragic $85,356 |
Demographics Similar to Czechoslovakians by Median Family Income
In terms of median family income, the demographic groups most similar to Czechoslovakians are Immigrants from Uzbekistan ($103,197, a difference of 0.070%), Immigrants from Peru ($103,534, a difference of 0.25%), Alsatian ($103,010, a difference of 0.26%), South American Indian ($103,624, a difference of 0.34%), and English ($103,684, a difference of 0.40%).
| Demographics | Rating | Rank | Median Family Income |
| Immigrants | Sierra Leone | 66.2 /100 | #162 | Good $103,990 |
| Costa Ricans | 66.2 /100 | #163 | Good $103,989 |
| Sierra Leoneans | 64.7 /100 | #164 | Good $103,859 |
| Slovaks | 63.1 /100 | #165 | Good $103,729 |
| English | 62.6 /100 | #166 | Good $103,684 |
| South American Indians | 61.9 /100 | #167 | Good $103,624 |
| Immigrants | Peru | 60.8 /100 | #168 | Good $103,534 |
| Czechoslovakians | 57.6 /100 | #169 | Average $103,273 |
| Immigrants | Uzbekistan | 56.6 /100 | #170 | Average $103,197 |
| Alsatians | 54.3 /100 | #171 | Average $103,010 |
| Immigrants | Eritrea | 51.9 /100 | #172 | Average $102,823 |
| Belgians | 51.4 /100 | #173 | Average $102,788 |
| Finns | 50.0 /100 | #174 | Average $102,676 |
| Immigrants | Eastern Africa | 47.1 /100 | #175 | Average $102,451 |
| French | 46.1 /100 | #176 | Average $102,368 |