Ottawa vs Argentinean Median Family Income
COMPARE
Ottawa
Argentinean
Median Family Income
Median Family Income Comparison
Ottawa
Argentineans
$86,380
MEDIAN FAMILY INCOME
0.0/ 100
METRIC RATING
300th/ 347
METRIC RANK
$112,665
MEDIAN FAMILY INCOME
99.4/ 100
METRIC RATING
76th/ 347
METRIC RANK
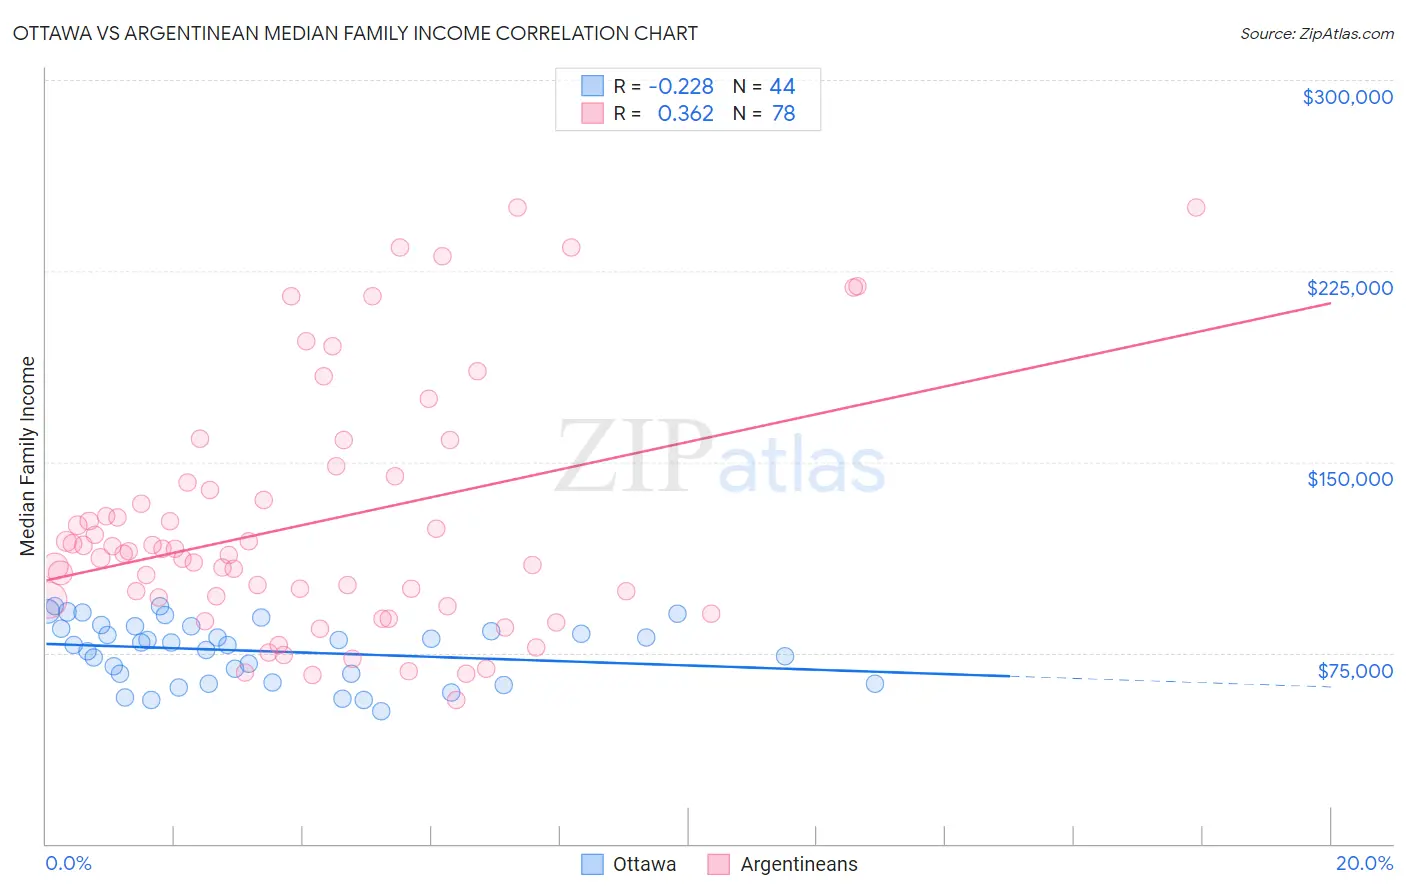
Ottawa vs Argentinean Median Family Income Correlation Chart
The statistical analysis conducted on geographies consisting of 49,943,189 people shows a weak negative correlation between the proportion of Ottawa and median family income in the United States with a correlation coefficient (R) of -0.228 and weighted average of $86,380. Similarly, the statistical analysis conducted on geographies consisting of 296,932,398 people shows a mild positive correlation between the proportion of Argentineans and median family income in the United States with a correlation coefficient (R) of 0.362 and weighted average of $112,665, a difference of 30.4%.
Median Family Income Correlation Summary
| Measurement | Ottawa | Argentinean |
| Minimum | $52,125 | $56,696 |
| Maximum | $93,380 | $250,001 |
| Range | $41,255 | $193,305 |
| Mean | $75,597 | $126,035 |
| Median | $78,416 | $114,562 |
| Interquartile 25% (IQ1) | $64,972 | $95,780 |
| Interquartile 75% (IQ3) | $84,864 | $141,982 |
| Interquartile Range (IQR) | $19,892 | $46,202 |
| Standard Deviation (Sample) | $11,825 | $48,159 |
| Standard Deviation (Population) | $11,690 | $47,849 |
Similar Demographics by Median Family Income
Demographics Similar to Ottawa by Median Family Income
In terms of median family income, the demographic groups most similar to Ottawa are Chippewa ($86,852, a difference of 0.55%), Colville ($85,792, a difference of 0.69%), Immigrants from Latin America ($86,989, a difference of 0.71%), Spanish American Indian ($85,728, a difference of 0.76%), and Hispanic or Latino ($85,647, a difference of 0.86%).
| Demographics | Rating | Rank | Median Family Income |
| Ute | 0.0 /100 | #293 | Tragic $87,596 |
| Fijians | 0.0 /100 | #294 | Tragic $87,387 |
| Yaqui | 0.0 /100 | #295 | Tragic $87,289 |
| Immigrants | Guatemala | 0.0 /100 | #296 | Tragic $87,191 |
| Cajuns | 0.0 /100 | #297 | Tragic $87,157 |
| Immigrants | Latin America | 0.0 /100 | #298 | Tragic $86,989 |
| Chippewa | 0.0 /100 | #299 | Tragic $86,852 |
| Ottawa | 0.0 /100 | #300 | Tragic $86,380 |
| Colville | 0.0 /100 | #301 | Tragic $85,792 |
| Spanish American Indians | 0.0 /100 | #302 | Tragic $85,728 |
| Hispanics or Latinos | 0.0 /100 | #303 | Tragic $85,647 |
| Mexicans | 0.0 /100 | #304 | Tragic $85,618 |
| Paiute | 0.0 /100 | #305 | Tragic $85,414 |
| Immigrants | Dominica | 0.0 /100 | #306 | Tragic $85,411 |
| Chickasaw | 0.0 /100 | #307 | Tragic $85,356 |
Demographics Similar to Argentineans by Median Family Income
In terms of median family income, the demographic groups most similar to Argentineans are Immigrants from Western Europe ($112,688, a difference of 0.020%), Immigrants from Eastern Europe ($112,527, a difference of 0.12%), Immigrants from Italy ($112,848, a difference of 0.16%), Laotian ($112,859, a difference of 0.17%), and Immigrants from Canada ($112,374, a difference of 0.26%).
| Demographics | Rating | Rank | Median Family Income |
| Immigrants | Bulgaria | 99.6 /100 | #69 | Exceptional $113,461 |
| Immigrants | Romania | 99.6 /100 | #70 | Exceptional $113,434 |
| South Africans | 99.5 /100 | #71 | Exceptional $113,229 |
| Afghans | 99.5 /100 | #72 | Exceptional $112,971 |
| Laotians | 99.5 /100 | #73 | Exceptional $112,859 |
| Immigrants | Italy | 99.4 /100 | #74 | Exceptional $112,848 |
| Immigrants | Western Europe | 99.4 /100 | #75 | Exceptional $112,688 |
| Argentineans | 99.4 /100 | #76 | Exceptional $112,665 |
| Immigrants | Eastern Europe | 99.4 /100 | #77 | Exceptional $112,527 |
| Immigrants | Canada | 99.3 /100 | #78 | Exceptional $112,374 |
| Italians | 99.3 /100 | #79 | Exceptional $112,372 |
| Immigrants | Croatia | 99.3 /100 | #80 | Exceptional $112,323 |
| Immigrants | North America | 99.2 /100 | #81 | Exceptional $112,151 |
| Immigrants | England | 99.2 /100 | #82 | Exceptional $112,038 |
| Immigrants | Egypt | 99.0 /100 | #83 | Exceptional $111,689 |