Immigrants from North Macedonia vs Immigrants from Somalia Median Family Income
COMPARE
Immigrants from North Macedonia
Immigrants from Somalia
Median Family Income
Median Family Income Comparison
Immigrants from North Macedonia
Immigrants from Somalia
$109,136
MEDIAN FAMILY INCOME
96.4/ 100
METRIC RATING
107th/ 347
METRIC RANK
$92,609
MEDIAN FAMILY INCOME
0.6/ 100
METRIC RATING
251st/ 347
METRIC RANK
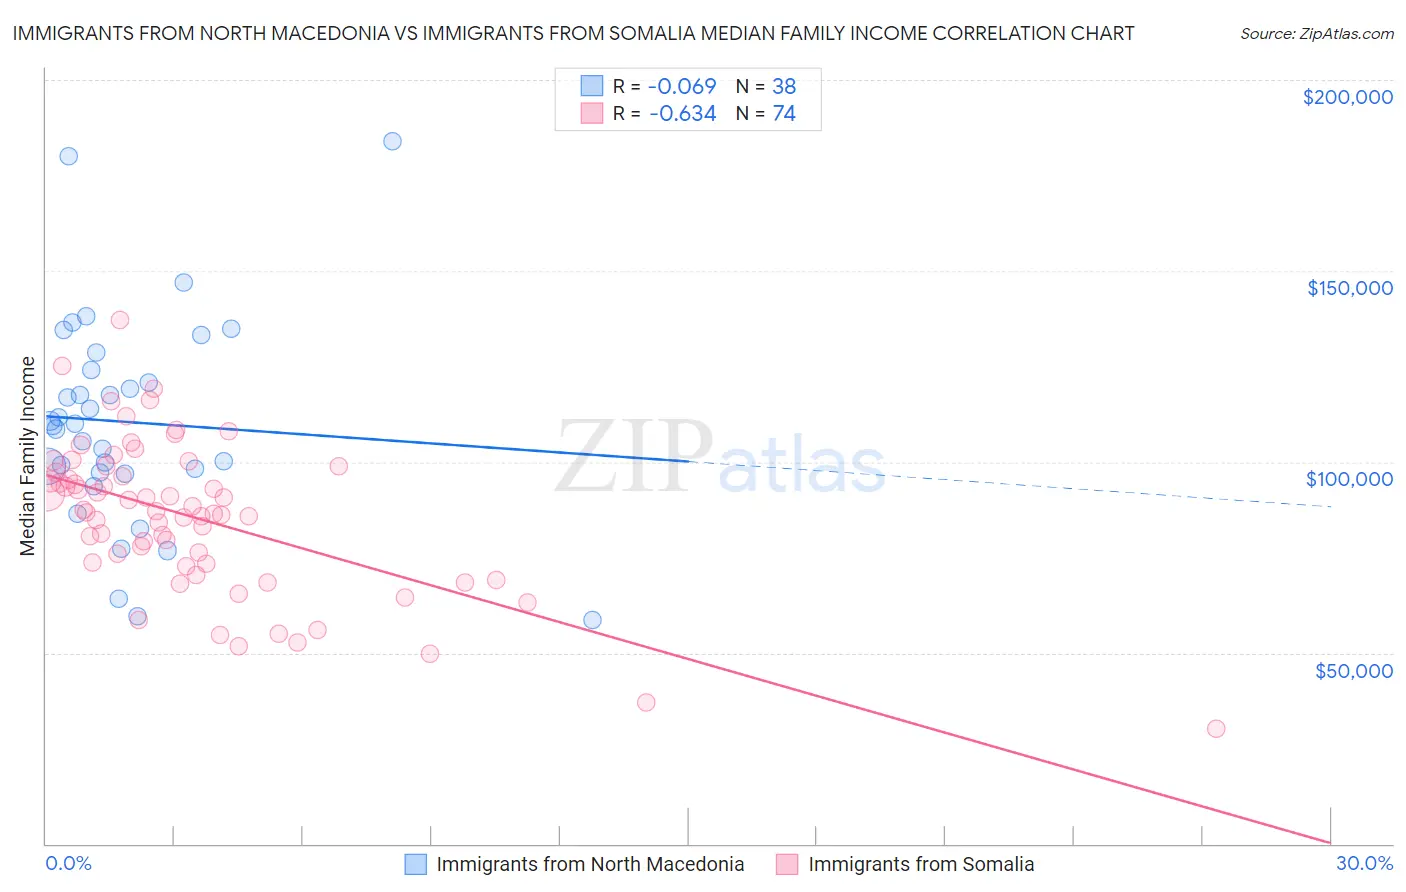
Immigrants from North Macedonia vs Immigrants from Somalia Median Family Income Correlation Chart
The statistical analysis conducted on geographies consisting of 74,300,796 people shows a slight negative correlation between the proportion of Immigrants from North Macedonia and median family income in the United States with a correlation coefficient (R) of -0.069 and weighted average of $109,136. Similarly, the statistical analysis conducted on geographies consisting of 92,093,839 people shows a significant negative correlation between the proportion of Immigrants from Somalia and median family income in the United States with a correlation coefficient (R) of -0.634 and weighted average of $92,609, a difference of 17.8%.
Median Family Income Correlation Summary
| Measurement | Immigrants from North Macedonia | Immigrants from Somalia |
| Minimum | $58,625 | $29,978 |
| Maximum | $184,091 | $137,115 |
| Range | $125,466 | $107,137 |
| Mean | $110,416 | $85,390 |
| Median | $109,646 | $86,897 |
| Interquartile 25% (IQ1) | $97,322 | $73,310 |
| Interquartile 75% (IQ3) | $124,196 | $97,167 |
| Interquartile Range (IQR) | $26,874 | $23,857 |
| Standard Deviation (Sample) | $27,502 | $19,854 |
| Standard Deviation (Population) | $27,137 | $19,720 |
Similar Demographics by Median Family Income
Demographics Similar to Immigrants from North Macedonia by Median Family Income
In terms of median family income, the demographic groups most similar to Immigrants from North Macedonia are Albanian ($109,136, a difference of 0.0%), Syrian ($109,299, a difference of 0.15%), Palestinian ($109,413, a difference of 0.25%), Immigrants from Brazil ($109,418, a difference of 0.26%), and Immigrants from Zimbabwe ($108,830, a difference of 0.28%).
| Demographics | Rating | Rank | Median Family Income |
| Macedonians | 97.3 /100 | #100 | Exceptional $109,668 |
| Immigrants | Ukraine | 97.2 /100 | #101 | Exceptional $109,645 |
| Assyrians/Chaldeans/Syriacs | 97.2 /100 | #102 | Exceptional $109,622 |
| Immigrants | Brazil | 96.9 /100 | #103 | Exceptional $109,418 |
| Palestinians | 96.9 /100 | #104 | Exceptional $109,413 |
| Syrians | 96.7 /100 | #105 | Exceptional $109,299 |
| Albanians | 96.4 /100 | #106 | Exceptional $109,136 |
| Immigrants | North Macedonia | 96.4 /100 | #107 | Exceptional $109,136 |
| Immigrants | Zimbabwe | 95.9 /100 | #108 | Exceptional $108,830 |
| Immigrants | Afghanistan | 95.6 /100 | #109 | Exceptional $108,709 |
| British | 95.6 /100 | #110 | Exceptional $108,705 |
| Immigrants | Western Asia | 95.6 /100 | #111 | Exceptional $108,691 |
| Immigrants | Poland | 95.3 /100 | #112 | Exceptional $108,570 |
| Immigrants | Saudi Arabia | 95.2 /100 | #113 | Exceptional $108,544 |
| Poles | 95.2 /100 | #114 | Exceptional $108,507 |
Demographics Similar to Immigrants from Somalia by Median Family Income
In terms of median family income, the demographic groups most similar to Immigrants from Somalia are Immigrants from El Salvador ($92,545, a difference of 0.070%), Immigrants from Guyana ($92,513, a difference of 0.10%), West Indian ($92,765, a difference of 0.17%), Immigrants from Barbados ($92,419, a difference of 0.21%), and Immigrants from Ecuador ($92,837, a difference of 0.25%).
| Demographics | Rating | Rank | Median Family Income |
| Sub-Saharan Africans | 1.0 /100 | #244 | Tragic $93,748 |
| Immigrants | Middle Africa | 1.0 /100 | #245 | Tragic $93,593 |
| Guyanese | 0.9 /100 | #246 | Tragic $93,373 |
| Immigrants | Senegal | 0.7 /100 | #247 | Tragic $92,912 |
| French American Indians | 0.7 /100 | #248 | Tragic $92,872 |
| Immigrants | Ecuador | 0.7 /100 | #249 | Tragic $92,837 |
| West Indians | 0.6 /100 | #250 | Tragic $92,765 |
| Immigrants | Somalia | 0.6 /100 | #251 | Tragic $92,609 |
| Immigrants | El Salvador | 0.6 /100 | #252 | Tragic $92,545 |
| Immigrants | Guyana | 0.6 /100 | #253 | Tragic $92,513 |
| Immigrants | Barbados | 0.5 /100 | #254 | Tragic $92,419 |
| Immigrants | Laos | 0.5 /100 | #255 | Tragic $92,239 |
| Nicaraguans | 0.5 /100 | #256 | Tragic $92,231 |
| Americans | 0.4 /100 | #257 | Tragic $92,096 |
| Osage | 0.4 /100 | #258 | Tragic $91,926 |