Menominee vs Immigrants from Sri Lanka Median Family Income
COMPARE
Menominee
Immigrants from Sri Lanka
Median Family Income
Median Family Income Comparison
Menominee
Immigrants from Sri Lanka
$79,563
MEDIAN FAMILY INCOME
0.0/ 100
METRIC RATING
334th/ 347
METRIC RANK
$120,263
MEDIAN FAMILY INCOME
100.0/ 100
METRIC RATING
30th/ 347
METRIC RANK
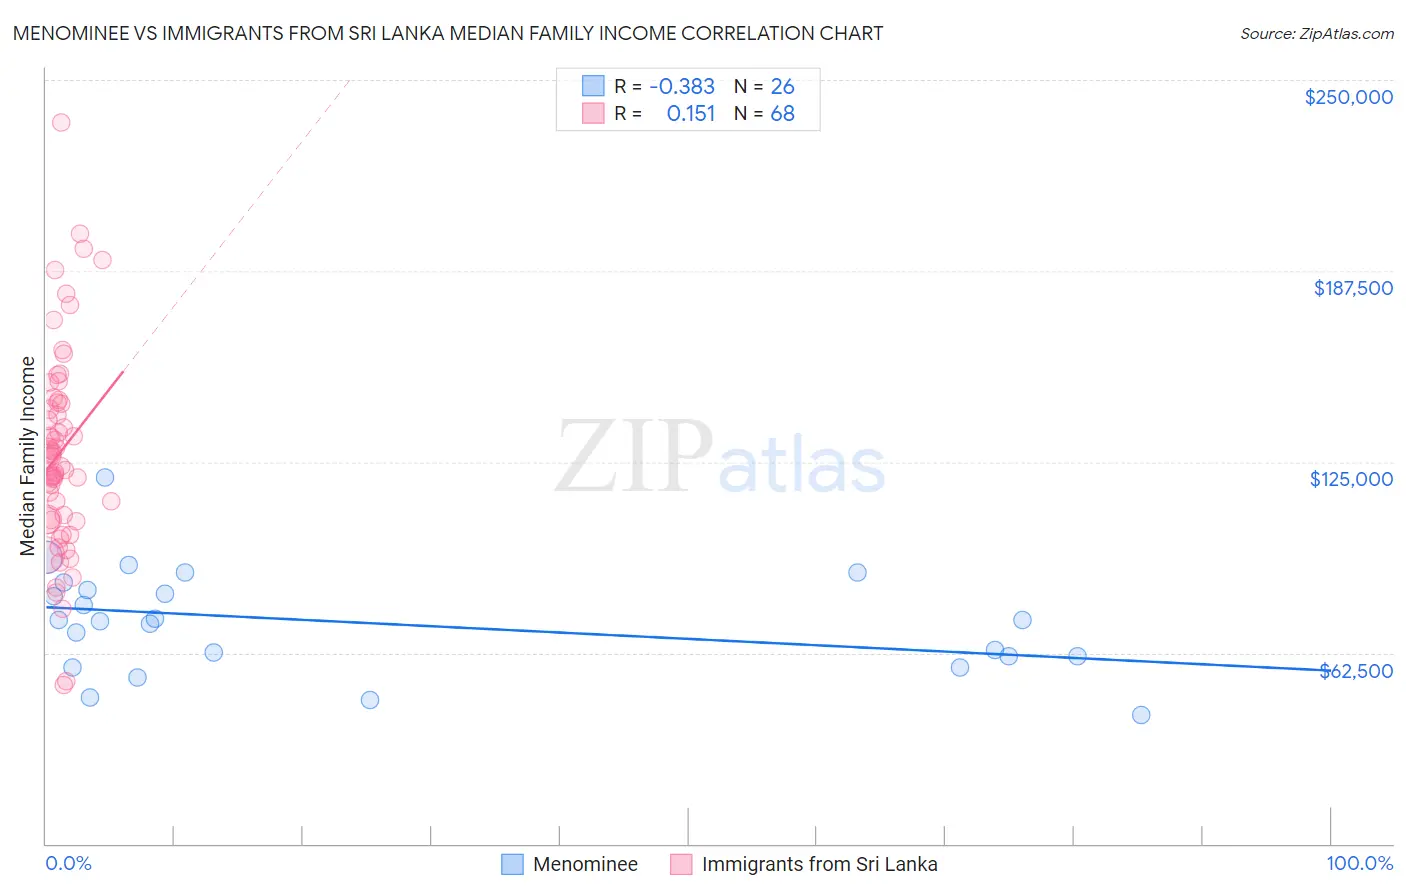
Menominee vs Immigrants from Sri Lanka Median Family Income Correlation Chart
The statistical analysis conducted on geographies consisting of 45,777,534 people shows a mild negative correlation between the proportion of Menominee and median family income in the United States with a correlation coefficient (R) of -0.383 and weighted average of $79,563. Similarly, the statistical analysis conducted on geographies consisting of 149,663,280 people shows a poor positive correlation between the proportion of Immigrants from Sri Lanka and median family income in the United States with a correlation coefficient (R) of 0.151 and weighted average of $120,263, a difference of 51.1%.
Median Family Income Correlation Summary
| Measurement | Menominee | Immigrants from Sri Lanka |
| Minimum | $41,944 | $51,807 |
| Maximum | $119,750 | $236,102 |
| Range | $77,806 | $184,295 |
| Mean | $72,340 | $127,906 |
| Median | $72,940 | $125,011 |
| Interquartile 25% (IQ1) | $61,250 | $106,120 |
| Interquartile 75% (IQ3) | $83,264 | $144,308 |
| Interquartile Range (IQR) | $22,014 | $38,188 |
| Standard Deviation (Sample) | $17,229 | $33,114 |
| Standard Deviation (Population) | $16,895 | $32,870 |
Similar Demographics by Median Family Income
Demographics Similar to Menominee by Median Family Income
In terms of median family income, the demographic groups most similar to Menominee are Yup'ik ($79,290, a difference of 0.34%), Kiowa ($80,885, a difference of 1.7%), Immigrants from Cuba ($78,249, a difference of 1.7%), Native/Alaskan ($80,908, a difference of 1.7%), and Yuman ($78,055, a difference of 1.9%).
| Demographics | Rating | Rank | Median Family Income |
| Arapaho | 0.0 /100 | #327 | Tragic $82,064 |
| Blacks/African Americans | 0.0 /100 | #328 | Tragic $81,912 |
| Dutch West Indians | 0.0 /100 | #329 | Tragic $81,852 |
| Cheyenne | 0.0 /100 | #330 | Tragic $81,385 |
| Immigrants | Dominican Republic | 0.0 /100 | #331 | Tragic $81,233 |
| Natives/Alaskans | 0.0 /100 | #332 | Tragic $80,908 |
| Kiowa | 0.0 /100 | #333 | Tragic $80,885 |
| Menominee | 0.0 /100 | #334 | Tragic $79,563 |
| Yup'ik | 0.0 /100 | #335 | Tragic $79,290 |
| Immigrants | Cuba | 0.0 /100 | #336 | Tragic $78,249 |
| Yuman | 0.0 /100 | #337 | Tragic $78,055 |
| Immigrants | Yemen | 0.0 /100 | #338 | Tragic $77,457 |
| Pima | 0.0 /100 | #339 | Tragic $77,431 |
| Hopi | 0.0 /100 | #340 | Tragic $77,188 |
| Pueblo | 0.0 /100 | #341 | Tragic $76,880 |
Demographics Similar to Immigrants from Sri Lanka by Median Family Income
In terms of median family income, the demographic groups most similar to Immigrants from Sri Lanka are Latvian ($120,301, a difference of 0.030%), Immigrants from Denmark ($120,445, a difference of 0.15%), Immigrants from France ($120,076, a difference of 0.16%), Russian ($120,487, a difference of 0.19%), and Asian ($119,955, a difference of 0.26%).
| Demographics | Rating | Rank | Median Family Income |
| Immigrants | Japan | 100.0 /100 | #23 | Exceptional $122,764 |
| Immigrants | Northern Europe | 100.0 /100 | #24 | Exceptional $121,840 |
| Turks | 100.0 /100 | #25 | Exceptional $121,202 |
| Immigrants | Switzerland | 100.0 /100 | #26 | Exceptional $120,726 |
| Russians | 100.0 /100 | #27 | Exceptional $120,487 |
| Immigrants | Denmark | 100.0 /100 | #28 | Exceptional $120,445 |
| Latvians | 100.0 /100 | #29 | Exceptional $120,301 |
| Immigrants | Sri Lanka | 100.0 /100 | #30 | Exceptional $120,263 |
| Immigrants | France | 100.0 /100 | #31 | Exceptional $120,076 |
| Asians | 100.0 /100 | #32 | Exceptional $119,955 |
| Bhutanese | 100.0 /100 | #33 | Exceptional $119,800 |
| Bolivians | 100.0 /100 | #34 | Exceptional $119,479 |
| Soviet Union | 100.0 /100 | #35 | Exceptional $119,262 |
| Israelis | 100.0 /100 | #36 | Exceptional $118,577 |
| Australians | 100.0 /100 | #37 | Exceptional $118,440 |