Scandinavian vs Immigrants from Canada Median Family Income
COMPARE
Scandinavian
Immigrants from Canada
Median Family Income
Median Family Income Comparison
Scandinavians
Immigrants from Canada
$104,410
MEDIAN FAMILY INCOME
70.8/ 100
METRIC RATING
158th/ 347
METRIC RANK
$112,374
MEDIAN FAMILY INCOME
99.3/ 100
METRIC RATING
78th/ 347
METRIC RANK
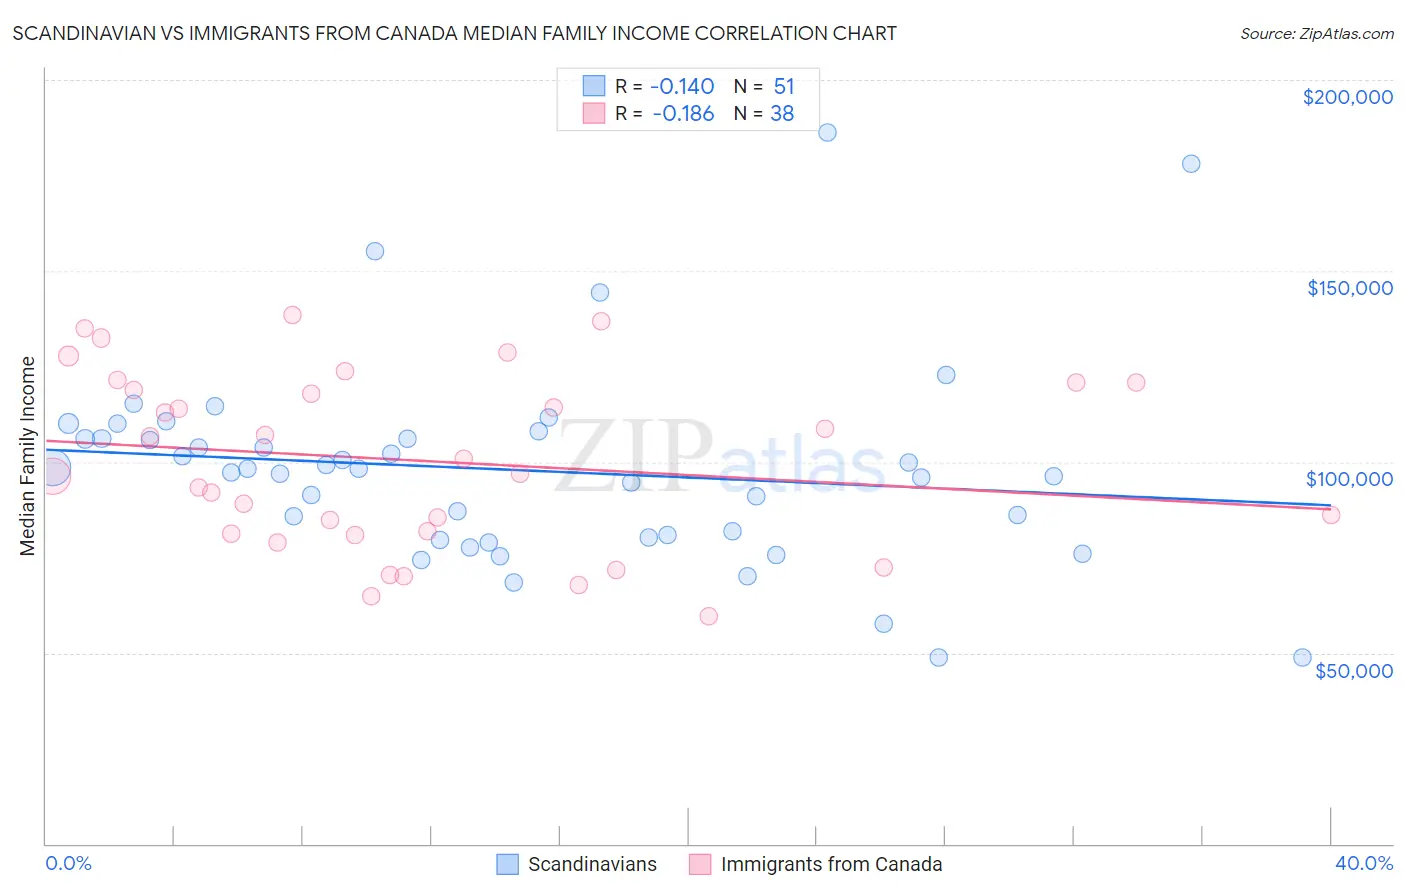
Scandinavian vs Immigrants from Canada Median Family Income Correlation Chart
The statistical analysis conducted on geographies consisting of 472,034,552 people shows a poor negative correlation between the proportion of Scandinavians and median family income in the United States with a correlation coefficient (R) of -0.140 and weighted average of $104,410. Similarly, the statistical analysis conducted on geographies consisting of 458,941,757 people shows a poor negative correlation between the proportion of Immigrants from Canada and median family income in the United States with a correlation coefficient (R) of -0.186 and weighted average of $112,374, a difference of 7.6%.
Median Family Income Correlation Summary
| Measurement | Scandinavian | Immigrants from Canada |
| Minimum | $48,750 | $59,444 |
| Maximum | $186,250 | $138,302 |
| Range | $137,500 | $78,858 |
| Mean | $97,868 | $100,298 |
| Median | $98,046 | $98,848 |
| Interquartile 25% (IQ1) | $80,113 | $81,159 |
| Interquartile 75% (IQ3) | $106,098 | $120,729 |
| Interquartile Range (IQR) | $25,985 | $39,570 |
| Standard Deviation (Sample) | $26,299 | $23,025 |
| Standard Deviation (Population) | $26,040 | $22,720 |
Similar Demographics by Median Family Income
Demographics Similar to Scandinavians by Median Family Income
In terms of median family income, the demographic groups most similar to Scandinavians are Swiss ($104,396, a difference of 0.010%), Moroccan ($104,488, a difference of 0.080%), Scottish ($104,288, a difference of 0.12%), Icelander ($104,282, a difference of 0.12%), and Basque ($104,760, a difference of 0.34%).
| Demographics | Rating | Rank | Median Family Income |
| Peruvians | 80.4 /100 | #151 | Excellent $105,444 |
| Immigrants | Albania | 79.1 /100 | #152 | Good $105,285 |
| Slavs | 77.9 /100 | #153 | Good $105,144 |
| Immigrants | Nepal | 76.3 /100 | #154 | Good $104,966 |
| Native Hawaiians | 75.8 /100 | #155 | Good $104,910 |
| Basques | 74.4 /100 | #156 | Good $104,760 |
| Moroccans | 71.6 /100 | #157 | Good $104,488 |
| Scandinavians | 70.8 /100 | #158 | Good $104,410 |
| Swiss | 70.7 /100 | #159 | Good $104,396 |
| Scottish | 69.5 /100 | #160 | Good $104,288 |
| Icelanders | 69.4 /100 | #161 | Good $104,282 |
| Immigrants | Sierra Leone | 66.2 /100 | #162 | Good $103,990 |
| Costa Ricans | 66.2 /100 | #163 | Good $103,989 |
| Sierra Leoneans | 64.7 /100 | #164 | Good $103,859 |
| Slovaks | 63.1 /100 | #165 | Good $103,729 |
Demographics Similar to Immigrants from Canada by Median Family Income
In terms of median family income, the demographic groups most similar to Immigrants from Canada are Italian ($112,372, a difference of 0.0%), Immigrants from Croatia ($112,323, a difference of 0.050%), Immigrants from Eastern Europe ($112,527, a difference of 0.14%), Immigrants from North America ($112,151, a difference of 0.20%), and Argentinean ($112,665, a difference of 0.26%).
| Demographics | Rating | Rank | Median Family Income |
| South Africans | 99.5 /100 | #71 | Exceptional $113,229 |
| Afghans | 99.5 /100 | #72 | Exceptional $112,971 |
| Laotians | 99.5 /100 | #73 | Exceptional $112,859 |
| Immigrants | Italy | 99.4 /100 | #74 | Exceptional $112,848 |
| Immigrants | Western Europe | 99.4 /100 | #75 | Exceptional $112,688 |
| Argentineans | 99.4 /100 | #76 | Exceptional $112,665 |
| Immigrants | Eastern Europe | 99.4 /100 | #77 | Exceptional $112,527 |
| Immigrants | Canada | 99.3 /100 | #78 | Exceptional $112,374 |
| Italians | 99.3 /100 | #79 | Exceptional $112,372 |
| Immigrants | Croatia | 99.3 /100 | #80 | Exceptional $112,323 |
| Immigrants | North America | 99.2 /100 | #81 | Exceptional $112,151 |
| Immigrants | England | 99.2 /100 | #82 | Exceptional $112,038 |
| Immigrants | Egypt | 99.0 /100 | #83 | Exceptional $111,689 |
| Immigrants | Hungary | 98.8 /100 | #84 | Exceptional $111,378 |
| Croatians | 98.8 /100 | #85 | Exceptional $111,370 |