Native/Alaskan vs Yugoslavian Householder Income Under 25 years
COMPARE
Native/Alaskan
Yugoslavian
Householder Income Under 25 years
Householder Income Under 25 years Comparison
Natives/Alaskans
Yugoslavians
$47,704
HOUSEHOLDER INCOME UNDER 25 YEARS
0.0/ 100
METRIC RATING
306th/ 347
METRIC RANK
$51,028
HOUSEHOLDER INCOME UNDER 25 YEARS
5.5/ 100
METRIC RATING
226th/ 347
METRIC RANK
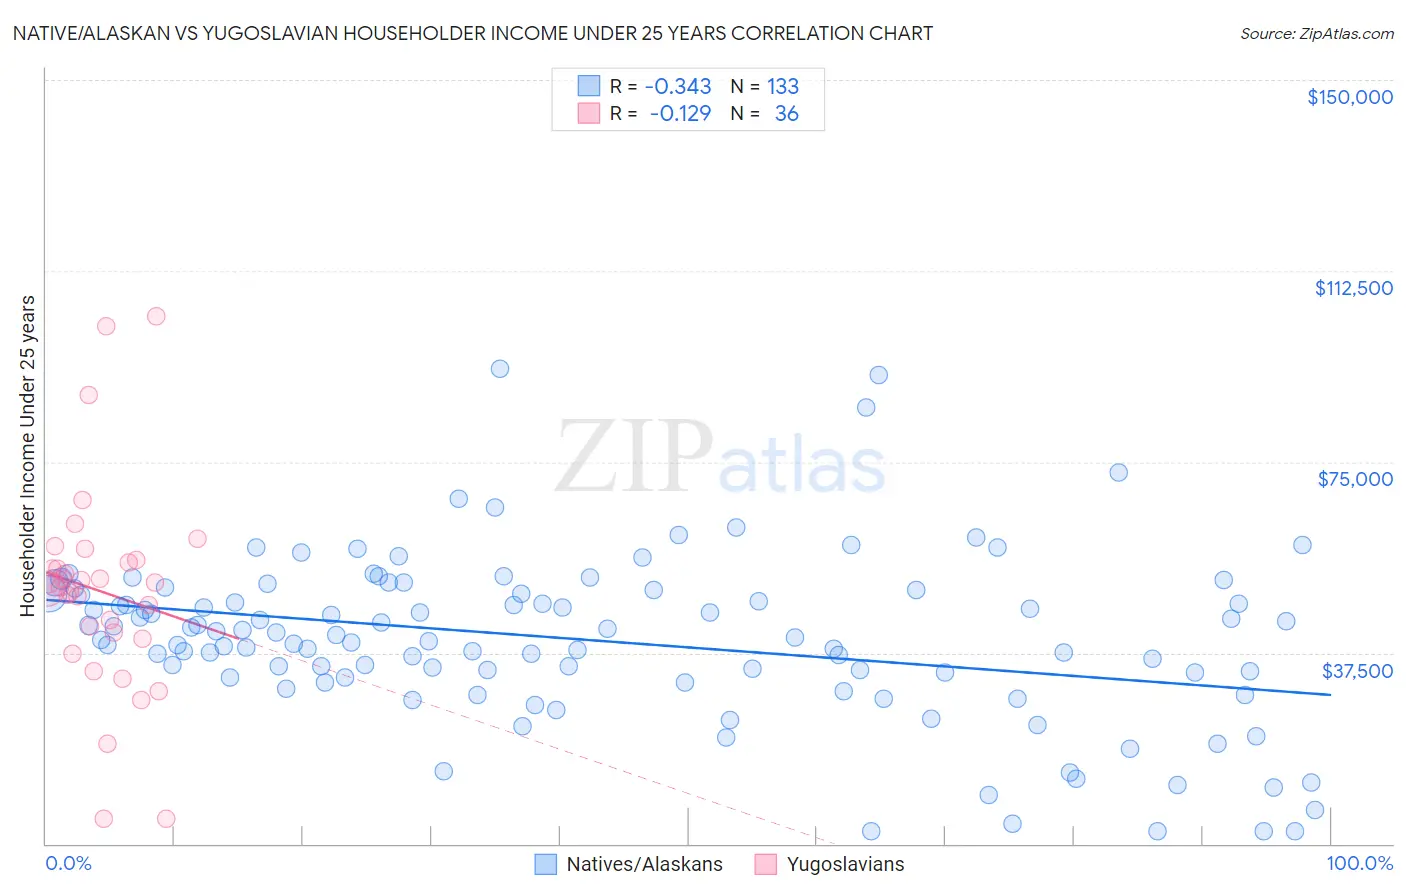
Native/Alaskan vs Yugoslavian Householder Income Under 25 years Correlation Chart
The statistical analysis conducted on geographies consisting of 416,135,889 people shows a mild negative correlation between the proportion of Natives/Alaskans and household income with householder under the age of 25 in the United States with a correlation coefficient (R) of -0.343 and weighted average of $47,704. Similarly, the statistical analysis conducted on geographies consisting of 250,106,142 people shows a poor negative correlation between the proportion of Yugoslavians and household income with householder under the age of 25 in the United States with a correlation coefficient (R) of -0.129 and weighted average of $51,028, a difference of 7.0%.
Householder Income Under 25 years Correlation Summary
| Measurement | Native/Alaskan | Yugoslavian |
| Minimum | $2,499 | $4,881 |
| Maximum | $93,365 | $103,500 |
| Range | $90,866 | $98,619 |
| Mean | $40,011 | $49,574 |
| Median | $40,469 | $50,803 |
| Interquartile 25% (IQ1) | $32,640 | $40,912 |
| Interquartile 75% (IQ3) | $49,547 | $55,573 |
| Interquartile Range (IQR) | $16,907 | $14,662 |
| Standard Deviation (Sample) | $16,339 | $20,475 |
| Standard Deviation (Population) | $16,277 | $20,189 |
Similar Demographics by Householder Income Under 25 years
Demographics Similar to Natives/Alaskans by Householder Income Under 25 years
In terms of householder income under 25 years, the demographic groups most similar to Natives/Alaskans are Bangladeshi ($47,589, a difference of 0.24%), Cherokee ($47,848, a difference of 0.30%), Comanche ($47,518, a difference of 0.39%), Menominee ($47,907, a difference of 0.43%), and Immigrants from Middle Africa ($47,916, a difference of 0.44%).
| Demographics | Rating | Rank | Householder Income Under 25 years |
| Immigrants | Honduras | 0.0 /100 | #299 | Tragic $48,267 |
| Immigrants | Somalia | 0.0 /100 | #300 | Tragic $48,135 |
| Immigrants | Kuwait | 0.0 /100 | #301 | Tragic $48,126 |
| Immigrants | Liberia | 0.0 /100 | #302 | Tragic $47,981 |
| Immigrants | Middle Africa | 0.0 /100 | #303 | Tragic $47,916 |
| Menominee | 0.0 /100 | #304 | Tragic $47,907 |
| Cherokee | 0.0 /100 | #305 | Tragic $47,848 |
| Natives/Alaskans | 0.0 /100 | #306 | Tragic $47,704 |
| Bangladeshis | 0.0 /100 | #307 | Tragic $47,589 |
| Comanche | 0.0 /100 | #308 | Tragic $47,518 |
| U.S. Virgin Islanders | 0.0 /100 | #309 | Tragic $47,448 |
| Iroquois | 0.0 /100 | #310 | Tragic $47,380 |
| Ottawa | 0.0 /100 | #311 | Tragic $47,366 |
| Bermudans | 0.0 /100 | #312 | Tragic $47,359 |
| Delaware | 0.0 /100 | #313 | Tragic $47,159 |
Demographics Similar to Yugoslavians by Householder Income Under 25 years
In terms of householder income under 25 years, the demographic groups most similar to Yugoslavians are Immigrants from Central America ($51,022, a difference of 0.010%), Immigrants from Jamaica ($51,038, a difference of 0.020%), Immigrants from Norway ($50,984, a difference of 0.090%), Belizean ($51,094, a difference of 0.13%), and Serbian ($51,106, a difference of 0.15%).
| Demographics | Rating | Rank | Householder Income Under 25 years |
| Arabs | 8.5 /100 | #219 | Tragic $51,219 |
| Immigrants | Germany | 8.0 /100 | #220 | Tragic $51,190 |
| Immigrants | Eastern Africa | 7.4 /100 | #221 | Tragic $51,158 |
| Spaniards | 6.8 /100 | #222 | Tragic $51,117 |
| Serbians | 6.6 /100 | #223 | Tragic $51,106 |
| Belizeans | 6.4 /100 | #224 | Tragic $51,094 |
| Immigrants | Jamaica | 5.6 /100 | #225 | Tragic $51,038 |
| Yugoslavians | 5.5 /100 | #226 | Tragic $51,028 |
| Immigrants | Central America | 5.4 /100 | #227 | Tragic $51,022 |
| Immigrants | Norway | 5.0 /100 | #228 | Tragic $50,984 |
| Yuman | 4.4 /100 | #229 | Tragic $50,933 |
| Jamaicans | 4.4 /100 | #230 | Tragic $50,929 |
| Ugandans | 4.3 /100 | #231 | Tragic $50,923 |
| Slovenes | 4.0 /100 | #232 | Tragic $50,886 |
| Pennsylvania Germans | 3.7 /100 | #233 | Tragic $50,852 |